


In two separate posts this week I argued that VIX has no predictive capacity and that it simply tracks the inverse of price. I also asserted that a new paradigm has emerged in the markets according to which equity investment risk is inversely proportional to price. I justified this based on the fact that momentum trading and flocking of hedge funds dominate the market activity. In this post, I provide solid evidence that proves beyond doubt that VIX is just a derivative of the inverse of price.
The chart below shows the 0-lag, 120-day correlation between VIX and the inverse of a SPY (chart updated as of 04/01/2021)
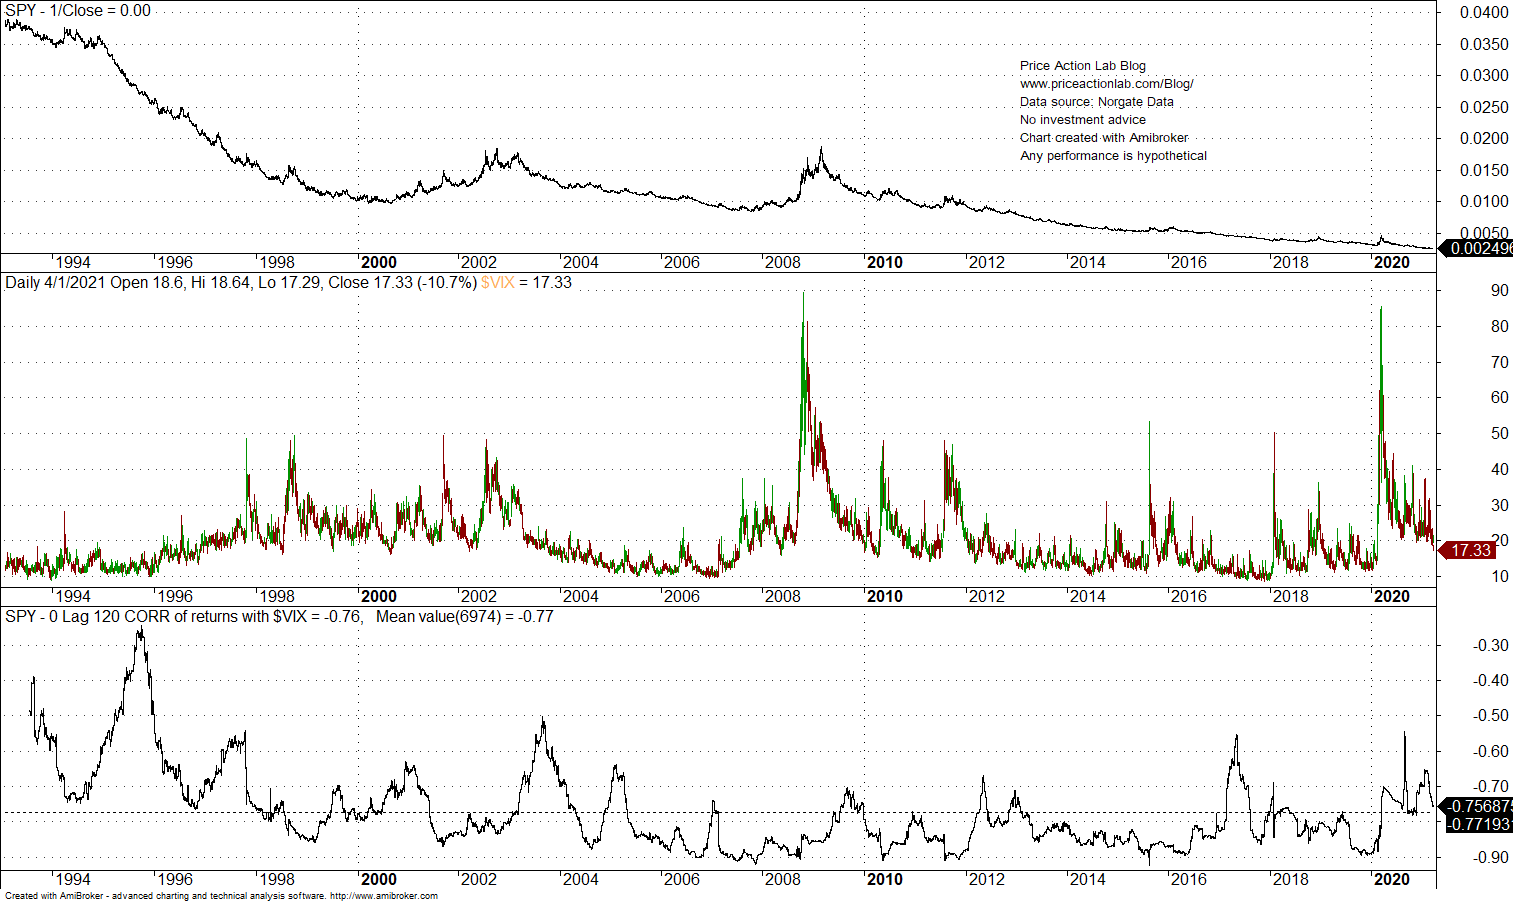
The chart shows the inverse of price of SPY. The first indicator pane shows VIX and the next pane its 120-day rolling correlation (returns) with the index. It may be seen that since inception of SPY, the average correlation is -0.77. This shows that the changes in the inverse price of the ETF close from one day to the next are highly correlated with the changes of the value of VIX from one day to the next. Furthermore, from the chart it may be seen that very high anti-correlation can occur in uptrends but also in downtrends. Thus, this correlation has no predictive capacity whatsoever.
So what is VIX good for? Anything else you might think of except for forecasting purposes. There is absolutely no predictive capacity here. If you just use the inverse of price of SPY, you maybe better off.
If you found this article interesting, I invite you follow this blog via any of the methods below.
Charting and backtesting program: Amibroker
Technical and quantitative analysis of major stock indexes and 34 popular ETFs are included in our Weekly Premium Report. Market signals for position traders are offered by our premium Market Signals service


