


In this post I introduce the general form of the Backtesting Robustness Index (BRI) I have developed and I give an example of its application to price patterns. This robustness index provides just another way of dealing with the notorious problems of backtesting and specifically with the sensitivity of backtesting results to variations of trading model parameters.
Backtesting trading models on historical data is probably one of the most misunderstood and abused practice in the field of trading system development. In this post I am not going to discuss in detail the problems and pitfalls of backtesting as these have been explored in more detail in previous articles and in my (out-of-print) book Profitability and Systematic Trading. Obviously, there is not a single best way of analyzing backtesting results for significance. One can use out-of-sample, forward, portfolio and all sorts of statistical tests, parametric or non-parametric, in trying to determine whether the results of the backtest are not due to curve-fitting the model to the price series.
A popular method for evaluating the significance of backtesting results relies on perturbing the trading model parameters and observing the changes in key metrics that measure performance. In this article I formulate a robustness index using the expectation of the trading model as the key metric. The reason I have selected the expectation and not another metric of the many that are available is because of its key role in the well-known Kelly formula.
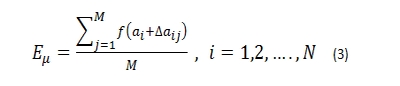
In general, the expectation E0 of a trading model is a function of N parameters αι , as follows:
![]()
To calculate the BRI, the parameters are perturbed M times based on some function so that the resulting expectancy after each perturbation is given by:
![]()
Next, we calculate the average of the M values of expectancy that result from the perturbations as follows:
The BRI is given by:
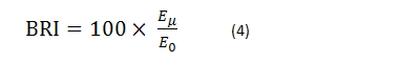
Thus, the BRI is the ratio of the average of the perturbed expectancy values to the unperturbed expectancy, expressed as a percentage. This is of course a general form and it does not tell us how to perturb the parameters and by how much, i.e. the perturbation function is not known, but it sets a foundation for the task. The specific perturbation function will depend on the nature of the trading system. In this article I provide a specific example for the class of parameterless price patterns with a profit target and stop-loss. This is an example of a TYPE-III system in regards to potential curve-fitting. The only two parameters to perturb are the profit target and stop-loss resulting in a change in exit levels but not of entry levels. Systems that involve a change in entry levels after a perturbation of parameters, like those based on moving average crossovers for example, are much more complex and susceptible to optimization.
Values of the BRI greater than 100 indicate excellent robustness to parameter perturbations. Values between 50% and 100% indicate good robustness. Values less that 5o% is a sign of potential curve-fitting and values below 0% is a clear indication of a curve-fit.
Implementation example
The BRI is implemented in an alpha version of Price Action Lab that may not become publicly available by the way. The perturbation function deals only with the profit target and stop-loss and varies them while preserving their ratio. The set of new values values involves a 60-40 ratio below and above the original values to bias the results towards tighter stops and profit targets. This is an example of the program output:
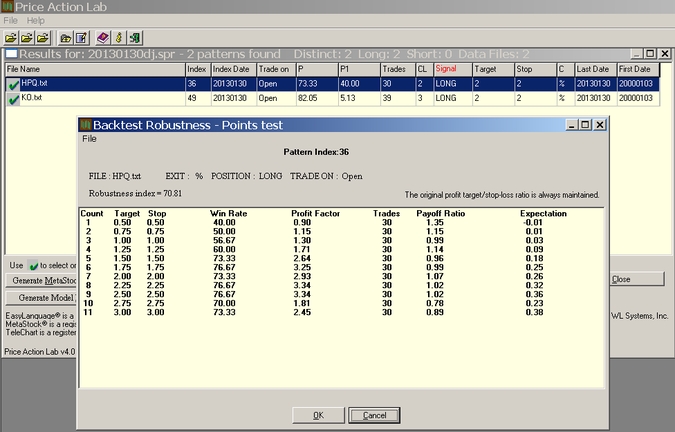
In the above analysis, a mouse right click causes the original profit target and stop-loss of 2% for a long pattern for HPQ to vary from 0.5% to 3.0%. For each perturbation the win rate, profit factor, number of trades, payoff ratio and expectation are calculated. The BRI value is 70.81% indicating acceptable robustness. When this test is used to supplement portfolio backtest results, the chances of identifying pattern formations that are not random but reflect opportunities in the context of probabilistic trading are substantially increased.
The signals presented here are not trade recommendations. The past performance of any trading system or methodology is not necessarily indicative of future results. Read the full disclaimer here.
Disclosure: no relevant positions.


