


Despite the fat tails and especially the one on the left side that includes one very rare event and a few other not so very rare, the distribution of S&P 500 daily returns is as good as it can get in a best of all possible worlds. Those who complain about the fat tails are missing the forest for a few trees.
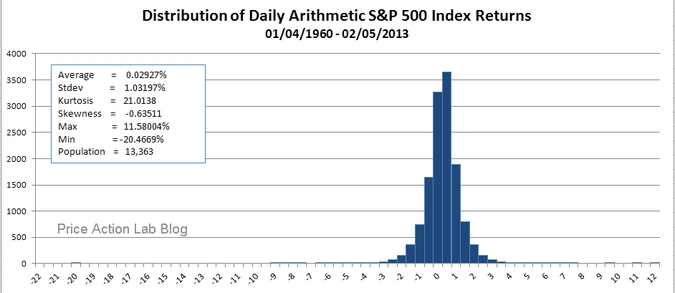
The October 19, 1987 return of -20.45% is the reason for the very long left tail. However, the distribution has a very high kurtosis of 21.01 and most of the observations are distributed around the mean. Only 56 out of the 13,363 observations show a return of less than -3%, meaning that the chance of such events is less than 1 in 250 given the data. Some people think that this is high probability for an advese daily event that can produce a loss larger than -3%. I think they should look for better opportunities if they they can find any. In spite of all the talk about fat tails, rare events and their statistics, the above graph shows that in the last 53 years the stock market has delivered solid, relatively low risk profits to investors and the performance is outstanding given all the adverse conditions and events that took place in that time period.
Disclosure: no relevant position at the time of this post and no plans to initiate any positions within the next 72 hours..
Charting program: Amibroker (Charts created with AmiBroker – advanced charting and technical analysis software. http://www.amibroker.com/”)


