


I have heard a lot of arguments in favor or against active fund management and passive investing. I present data here that strongly suggest that passive investing in stock indices should be actually treated as an alternative investment that involves substantial risks, or a solution of last resort for those that do not have the time or cannot do the research necessary for managing their investments a few times a year or even once every a few years based on signals they receive from trivial models.
In my opinion arguments for passive funds that concentrate on the fee structure of actively managed funds are designed to distract investors from focusing on the important issues. Historically such arguments always emerge only after stock indices have recaptured their highs from a prolonged period of correction. These arguments target investors who either do not have the time to research the markets are do not have the skills for it. The investors just hear that stocks made a new all-time high and that actively managed funds charge fees so they should better put their money in a passive fund.
Let us see how a passive investment in SPY since its inception has performed so far (including dividends):
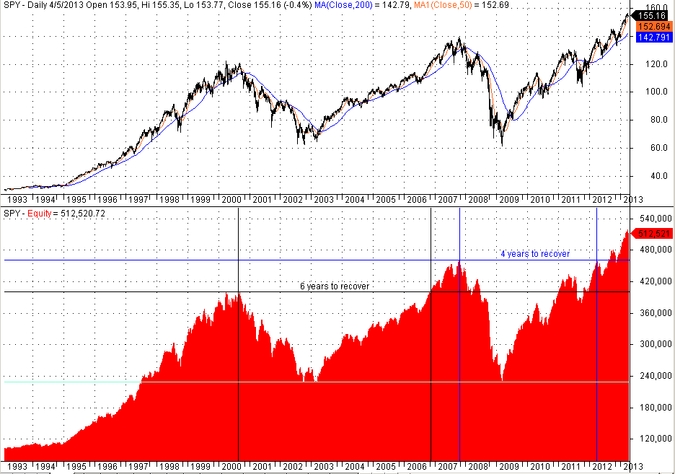
The above graph shows how $100,000 grew to $512,520.72 from SPY inception. That translates to a Compound Annual Return (CAR) of 6.55% but this performance is problematic as it is shown above because it included two humongous drawdowns. Recovery from the first drawdown took nearly 6 years as shown on the chart and from the second nearly 4 years. The second drawdown came about one year after the market recovered from the first. Thus, nearly half of the 21 years were spent underwater, as the next graph of underwater equity shows:
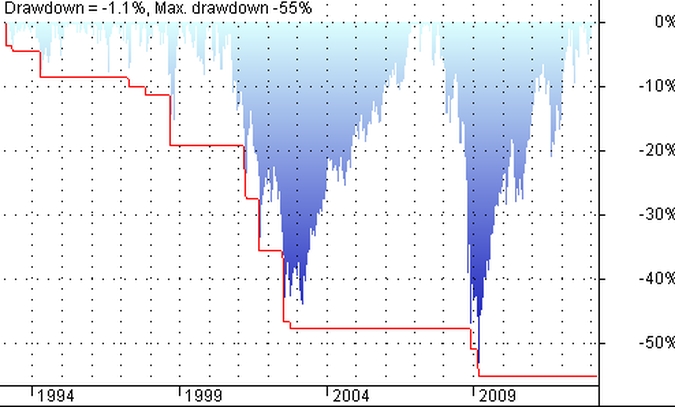
The consecutive drawdowns of -42% and -55% are an empirical proof that passive investing is a very risk strategy and any claims of recovery and eventual profit are based on hindsight. If the drawdown was higher than -70%, that would have prompted many passive investors to liquidate their position in an attempt to save what they could. Actually, even after a -30% drawdown some passive investors rush to liquidate in an effort to limit their losses. So any evaluation of passive investment funds to be complete should include withdrawal activity during drawdowns, something that can be viewed as active management by the part of the investors imposed on the passive fund.
On the other hand, a trivial, long only, 50-200 simple moving average crossover system during the same period would have resulted in a CAR equal to 9.63% and a max drawdown of -19.37% as shown on the equity graph below:
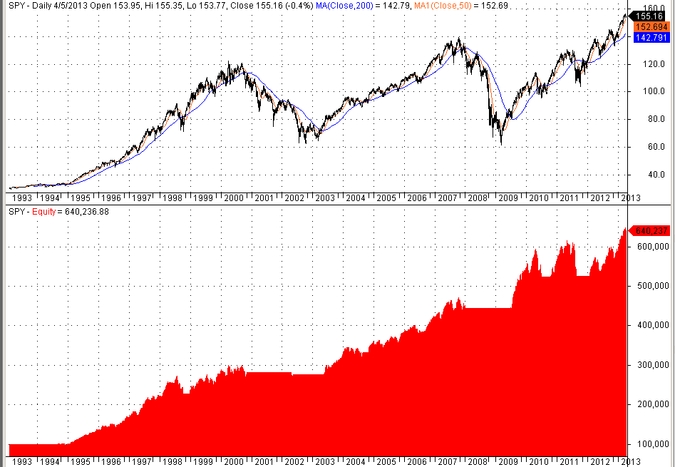
This is a non-optimized, plain vanilla, MA crossover system based on the two popular averages for short-term and longer-term timeframes. The difference from the passive investment are staggering. Not only a higher CAR but also a substantially smaller drawdown as the graph below shows:
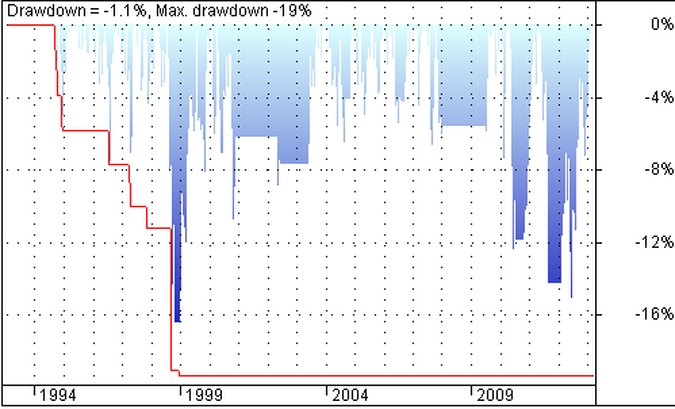
It may be seen that the two huge drawdown peaks have disappeared and the equity curve is now a lot smoother with periods of flat equity during which the market declined.
Now, this system is trivial to follow. It has generated only 9 long trades since 1993. Its worse year was a -7.4% and its win rate 88.89%, meaning that only one trade lost money. How easy is to follow such system for an investor? It is actually a trivial task for most who know how to use a personal computer.
In another post this week I will present results from a slight modification of the above simple system that attempts to limit risk even further by adding one more parameter. This increases the number of trades to 19 but the worse year loss is now only -6.4% in 1994.
Edit on 04/20/2013: I have concluded that the increase in the complexity of the above trend-following system after adding one more parameter is not justified based on the performance gains obtained and as a result I will not publish it.
Disclosure: no relevant positions at the time of this post
Charting program: Amibroker (Charts created with AmiBroker – advanced charting and technical analysis software. http://www.amibroker.com/”)


