


Is your fund doing better this year so far than the average of a large number of traders tossing coins to trade the market? Given that the buy and hold return (less dividends) of SPY is close to 20% YTD, how does the performance of your trading, or fund manager, compare to that? The simulation in this blog post provides some interesting statistics that should not be surprising, however, given the strength of this bull market.
Suppose that instead of buying SPY at the start of the year and holding it, you instead decided to toss a coin near the close of the first trading day. If heads came up you fully invested your capital and then you tossed the coin at the following close (or just in time for an MOC order). If heads came up again, then you stayed long but if tails came up, then you sold everything (commission $0.01 per share is assumed). Then you repeated again the same coin tossing next day, and so on. Obviously, your coin tossing outcomes will represent just one possible random sequence out of infinitely many possibilities. However, if one simulates a very large number of such sequences, some interesting statistics can be obtained for the net percent return, which is calculated as 100 x net profit/initial capital. The statistics shown on the graph below are for 20,000 such sequences, a number large enough to obtain convergence to the actual distribution of random returns in the SPY case:
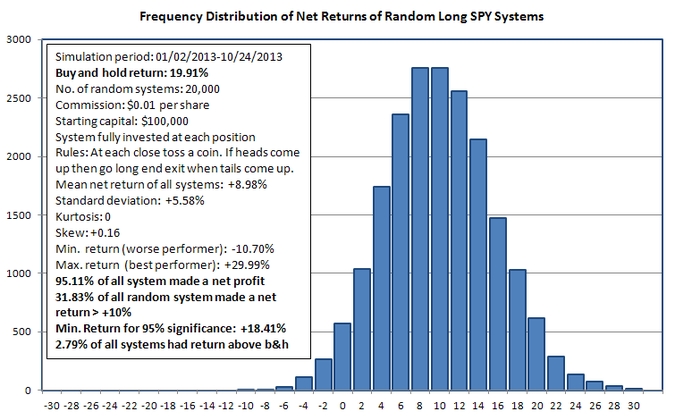
The results of the simulation are shown on the above graph of the distribution of net returns of the random systems corresponding to the random tossing sequence outcomes. The first interesting fact to notice is that 95.11% of all random traders made a profit greater than 0. This is much better than in a casino and shows that a bull market is the ultimate gambling environment. Just toss a coin and you may make up to 30% in 10 months or lose up to -11%. But the probability of a loss is less than 5%.
Then, about 31.83% of all random traders made a net profit greater than 10%. How is your fund manager doing so far? It is understood that beating the buy and hold return of a strong bull market, such as the one in place this year, is very difficult, or even nearly impossible. The simulation says, however, that about 3 out of every 10 random traders made a return in excess of 10%. If your fund manager is making less than that, then his approach is worse than the top 30% of random traders. If your fund manager is losing money, then his approach may be worse than random.
Then there is the question of skill versus luck. I know this is a popular subject nowadays just because some people thought they suddenly, contrary to past wisdom, discovered the answer. Luck and skill cannot be easily defined and, besides that, the best we can do is to calculate probabilities that rule out one in favor of the other. In this case, as it is shown on the graph, all returns below +18.41% do not provide evidence against the hypothesis that the process that generated them has a zero mean. Therefore, as expected, only returns very close to the buy and hold return can rule out luck in favor of skill. For example, a 10% return can be due to sheer luck since 31.82% of all random traders in the simulation exceeded it. Ruling out luck may be possible within some confidence limits but there are always exceptions because of the probabilistic nature of these tests.
The kurtosis of the distribution on the graph is 0 meaning that this is a fairly normal distribution with a small positive skew. The positive skew is present because of the strong bull market. Suppose we did not know whether long or short positions should be taken, i.e. whether the market would rise of fall in 2013 and we decided to take both, i.e. to exit long positions when tails come up and reverse to a short and then exit the short when heads come up and reverse to a long, and so on.
In this case, it turns out that the minimum return decreases to about -36% from
-10.70%. The maximum return also increases to about +44%. The mean return is now negative at -1.22% as compared to a mean return of about +9% in the long-only case. Nearly 14% of random traders make +10% or higher return. This is a smaller percentage in this case, as opposed to 31.83% in the long-only case, but not small enough to rule out luck. The required return to provide evidence against luck drops to +16.36% from +18.41% due to the short positions. Also, about 43.1% of all random traders show a positive return in this case. Four winners for every 10 gamblers is a lot better than in a casino.
Does the above analysis imply that it is better to trade randomly than using a system? The answer is no. This may be a better way for recreational traders but not for those who intend to develop their skills. This type of analysis serves the purpose of providing statistics to compare the returns of those who have, or claim to have, developed trading skills. If a trader cannot beat a certain percentage of random traders, like for example, 75% of them, then his skills are highly questionable. In the long/short case above dealing with SPY trading, that would amount to a return of about 5.33% and in the long-only case a return of about 12.7%, YTD. Of course, there are many other measures of performance but in this blog post I only dealt with one of them that compares actual performance to that of an ensemble of simulated random traders.
Disclosure: no relevant positions.
Charting program: Amibroker
Disclaimer


