


If one looks at a long-term chart of SPY it appears that the stock market is the best passive investment in spite of the -55% drawdown in 2008, which for some was a chance to average down and increase returns. With a mean daily return of +0.03% and a compound annual return of 7.02% (9.01% including dividends) it looks like there is no need for active management. But long-term charts are illusions and this becomes evident when one looks at the S&P 500 index chart. The 1987 black swan of -20.47% is the proof.
The daily chart of SPY below (unadjusted data) with the daily returns plotted on the bottom pane looks like the ultimate investment environment for the long term:
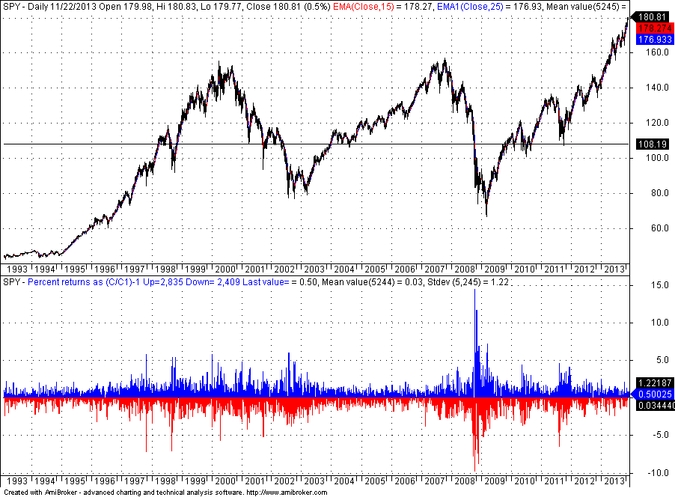
With a mean daily return of +0.03% and a compound annual return of 7.02% (unadjusted for dividends and inflation), even with two large drawdown periods, this seems to be the best passive investment bet. However, this chart does not tell the whole story. The S&P 500 index chart since 1960 below, tells a different story that shows that long-term performance may be an illusion when statistics are included:
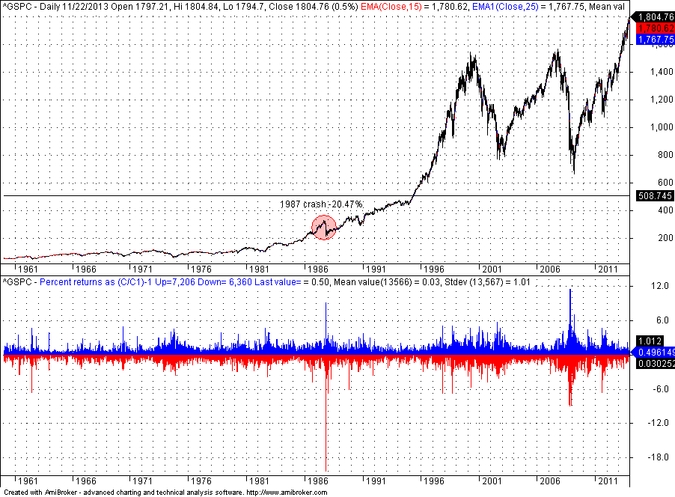
Although on the price chart above the 1987 crash is barely noticeable and the overall performance looks spectacular, the daily return for that rare down day was -20.47%. Now some wonder why active portfolio management became so popular in the 1990s. They should realize that a -20% loss in one day is enough to discourage many people from investing in the market and actually many were discouraged. A large percentage of those brave who stayed in the market and digested the drop turned to managers for help, hoping that they could find someone who would manage losses during such events, or even predict them. The 1987 crash, although almost forgotten by now and after the recent new highs in the index, played a decisive role in diverting funds from the stock to the bond market. A 20-sigma event, a.k.a. a terrible black swan, like the -20.47% daily drop is not possible in the bond market, at least that is what most investors believe. Theoretically it is possible, anything of that kind is possible but most investors believe that the Fed will never allow that to happen in bonds.
Therefore, when the S&P 500 index chart is analyzed with statistics of daily returns, it shows that longer-term charts are illusions and passive investing gains may evaporate fast. Ask yourself the following question: Would you stay in the stock market if there was a -20% drop in one day on a closing basis? Some would but the majority would try to find an opportunity to get out being afraid of another drop like that coming their way.
Although most investors know that active management underperforms passive investing in the short-term, in the longer-term they prefer to pay someone to monitor the performance of their fortunes and be prepared to pull the sell stop trigger before losses accumulate, even at a lower return. Also, traders prefer short-term and intraday trading because they can manage their risk. Can a 20-sigma event happen again? History says it can and it possibly will, we do not know when but given the extraordinary performance of the last 4 years and the proliferation of robots and HFT, the probability of such event has increased substantially.
Disclosure: no relevant positions.
Charting program: Amibroker
Disclaimer


