


Yes, this is a heated subject but I hope that the example from recent SPY data will convince you that there is no easy answer.
The other day I wrote an article to demonstrate that traders often attribute timing ability to models that in reality have none and a reason for this is the dividend effect. However, this turned into a heated discussion about adjusted vs. unadjusted data in the blog comment section although that was not my initial intention. I was even accused of being ignorant in emails and that I do not account for dividends that buy cars, for example. I will post an example from recent SPY data below that will demonstrate the impact of data adjustments.
The most recent dividend payment in SPY was $1.03 on June 19.
On the chart below, the top series is adjusted SPY data, the bottom series ($SPY) is unadjusted and the vertical marker is set at the dividend day:
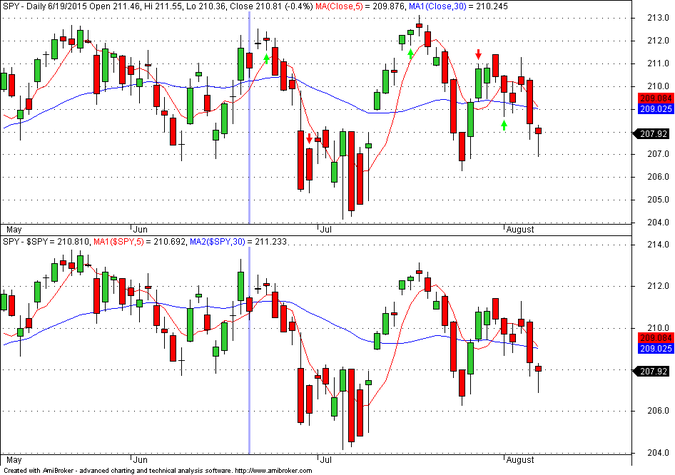
Note that in both series, data after June 18, 2015, are actual, and unadjusted, because there is no more dividend payment.
Next consider a long-only, 5-30 crossover system that buys and sells at the open of the day following the signal.
Buy if ma(5) > MA(30)
Sell if MA(5) < MA(30)
Backtest starts on June 18, 2015. First, the results are based on adjusted trade series:

There is a first trade entry on June 23 and the exit is on June 30. Trade loss is -2.30%.
Note that these are actual prices. The trade is taken and booked. There is nothing you can do to change the results in the future.
Now results using unadjusted data:

The first entry is again on June 23 but the exit is on June 26. The trade loss is -0.87%.
You lose additional 143 basis points using adjusted data and your boss is very upset.
Both are actual trades. You can only change the results with backtesting hindsight.
Don’t worry, next time you may be lucky and you may make more with adjusted data. So ask your boss to forgive you.
That was the point though. For real traders there are differences.
What to use? I do not have an easy answer for real trading but in the case of testing models for significance, dividend-adjusted data can lead to wrong results.
Splits, and rollovers in the case of futures, have no effects if proper exits are used.
As I wrote in the comment section of the controversial blog the other day:
“If there are spits data must be adjusted but relative returns stay invariant under the transformation because C/Cn stays invariant as both numerator and denominator are divided by the same constant. Therefore, backtests are good as long as they do not refer to point exits or absolute price levels.
On the other hand, in futures where the rollover introduces a fixed displacement of all prices in points, first differences stay invariant (C-Cn) and backtests are good as long as they do not refer to percentage gains.
I have talked about the above in my out-of-print book in 2000 but the concepts are easy to understand if one is willing to do some test examples.”
Thanks to those who provided support during the controversy the other day.
You can subscribe here to notifications of new posts by email.
Charting program: Amibroker
Disclaimer
Detailed technical and quantitative analyses of Dow-30 stocks and popular ETFs can be found in our Weekly Premium Report.
© 2015 Michael Harris. All Rights Reserved. We grant a revocable permission to create a hyperlink to this blog subject to certain terms and conditions. Any unauthorized copy, reproduction, distribution, publication, display, modification, or transmission of any part of this blog is strictly prohibited without prior written permission.


Rich
Michael, are you stating that it is not possible to perform a back test of a technical trading system using an adjusted price series that exactly replicates what would have happened in live trading?
Michael Harris
In terms of dividend adjusted performance it is possible to do that but if you look at the entry and exit prices, they may not correspond to the actual prices recorded during real trading. Do you think this does not amount to a difference?
Actually, in many cases the entry and exit dates will not correspond to those generated in unadjusted data.
Therefore, the following often change from unadjusted to adjusted data:
1. Entry and exit points
2. Entry and exit dates
The above two combined define a different backtest in general but not necesserily.
Thus, I am really surprised that you asked this question. A better question would be what series is best to use. I said:
"What to use? I do not have an easy answer for real trading but in the case of testing models for significance, dividend-adjusted data can lead to wrong results."
I will not take a dogmatic stand on this one like some do. This is not a trivial problem.
But I have a few examples for discretionary trading I will post in a blog soon that may surprise you.
Michael
evo34
(Parts of this comment were edited by the moderator)
Unadjusted data should never be used — in backtesting or in live trading — except in the rare instance where you think the raw (unadjusted) dollar value of the price is critical to your system.
If a stock issues a 1% div and the price drops 1% overnight, no, this will not trigger my system that looks for 1% overnight drops.
Michael Harris
Just look at the 1% drops on a stock chart without date axis. How do you know which ones are due to price action and which ones are due to dividends? You do not. It is noise.
As someone else wrote above, when you trade based on adjusted data, after time passes and you backtest your system and you find different entry and exit prices than those you recorded through actual trading. If that is fine with you its your choice. Do as you like but do not try to convince others that they are stupid (edited parts of your post) because they do not do things your way. Many disagree with you.
Rich
If a company has a choice of paying a 5% dividend, a 1% dividend or not paying any dividend at all it makes almost no economic difference to either the company or the stock owner (ignoring tax technicalities and assuming the company has the cash). This is reflected in the adjusted price series being identical in both cases. The unadjusted price series will be different in an arbitrary, highly disjointed and economically meaningless way).
If you are claiming that a back test using adjusted data cannot match live trading then you are wrong. I agree that you have to think carefully to make sure you do the back test correctly, but that is not a reason not to use adjusted data.
A better article would be "how to correctly conduct a back test using adjusted data".
Michael Harris
Hello Rich,
"If you are claiming that a back test using adjusted data cannot match live trading then you are wrong. "
Just read Roman's comment above. Obviously you did not read the example in this post carefully. This does not concern only backtests but discretionary trading. What is best to use? You might have missed what I wrote:
"What to use? I do not have an easy answer for real trading but in the case of testing models for significance, dividend-adjusted data can lead to wrong results."
Michael
Rich
I have read Roman's comment. I am strongly convinced that a properly done back test with adjusted data is the same as live trading. Roman has done his back test incorrectly. Discretionary trading is not relevant here since it is not back testable.
Please could you also comment on this:
"If a company has a choice of paying a 5% dividend, a 1% dividend or not paying any dividend at all it makes almost no economic difference to either the company or the stock owner (ignoring tax technicalities and assuming the company has the cash). This is reflected in the adjusted price series being identical in all cases. The unadjusted price series will be different in an arbitrary, highly disjointed and economically meaningless way."
or as evo34 put it:
"If a stock issues a 1% div and the price drops 1% overnight, no, this will not trigger my system that looks for 1% overnight drops."
as carl puts it:
"one lives with adjusted prices either way: dividend trend drift as you articulated, or ex-dividend price suppression, as I would characterize it"
In answer to "what to use?", for reasons explained in the above paragraphs you should always use adjusted (total return) data.
Please write an article "How to do correctly do a back test with adjusted data".
Michael Harris
Hello Rich,
Since you appear to have all the answers, I invite you to write the blog and explain to us how to do a proper backtest with adjusted data. If you do not have a blog you can upload your analysis on Scribd.
Michael
COMMENTS OFF
Bo
It's the total return index that should be used in the back tests. Of course in many cases you cannot trade total return index. You will have to use the closes ETF as a proxy which means there will be slight discrepancy between your best tests results and actual trading results. You actually can think of this as part of the slippage. The longer the holding period, the less trading frequency, the smaller the impact. Actaully this issue is much more serious in back testing agriculture commodities due to the backwardation/contago.
Michael Harris
Hello Bo,
Using a total return index may be appropriate with asset allocation and trend-following models. However, also in that case there is risk of attributing real significance to a trading model when it has none. The TLT example in my other post illustrates that effect.
Michael
Carl
… and while this list won't help the wallet this year, it does show the size of a few special dividends in 2012
Michael Harris
Hi Carl,
Most trading system developers do not deal with individual stocks but with securities that diversify company specific risk, such as ETFs, or with futures and forex. With ETFs, actual large gaps due to dividends are rare and there is no need to adjust data due to them. if one showed you a chart of SPY without a date axis you would have trouble identifying ex-dividend days and differentiating adjustments from regular price action.
Michael
Carl
It boils down to whether the trader wants the ex-dividend "jumps" to impact the the trading system. If yes, use unadjusted data, if no, use adjusted data.
In the unadjusted view, the trader benefited from the ex-dividend data "jump" and the trader exited before the market decline of $3 over the next few days. What if the market had gone up? What does the "jump" have to do with either?
I don't understand the logic that states we need prices adjusted for splits but not dividends: Stocks are adjusted for splits. Whether its a 2 for 1, 10 for 1, or 5 for 4. But when a company issues a 20% special dividend, and the stock drops 20% ex-dividend, is that price jump something traders should simply accept (no adjustment) and then bail out of their moving average system because the unadjusted price dropped 20%?
You have a good example of an unadjusted price gap changing the outcome… but the trading outcome (gain/loss) is dependent as well on the subsequent direction of the price.
If the dividend was a special dividend, what would you have wanted your data to reflect – adjusted or unadjusted?
I would need to see about 3 years of a trading system to see how much of this adjusted/unadjusted issue is cancelled out. Regardless, I don't want my trading systems knocked around by gappy data – I want my systems to reflect splits and dividends.
What I find more interesting is dividend adjustments impact on long term technical patterns, such as the double top "hiding" impact you discussed in 2011. But, in hindsight, the unadjusted double top was in fact not a double top, while the adjusted continuation pattern was a valid continuation pattern, so maybe the dividend adjustment is good for pattern matching too!
Without an extended analysis on a group of trading systems (monte carlo -esque), I would have to remain of the opinion that any adverse impact on consistently applied adjusted data (to backtest and to live trading) is random and basically minor market noise.
Michael Harris
Hello Carl,
Thank you for your input.
If you know of a stock that will issue a 20% dividend please let us know.:)
Sure, in that case you will need to adjust the data. But the point is not even this. It is a trivial point and concerns real traders: When you trade you use actual data. If you keep adjusting the data, past entry prices will not correspond to real traded prices although returns may be the same or adjusted by dividends.
If you can tolerate that, then it is fine. As I wrote, there is a choice to be made here.
However, there is a more serious issue that concerns system development: Should you use adjusted or unadjusted data? In my opinion and as I showed by a simple example in the previous blog on this subject, dividend adjusted data may cause effects that could fool one into believing that the model has timing ability when it has none. For example, if you toss a coin today and you get tails and you buy stock XYZ and next day it pays a 20% dividend, will you conclude that your coin toss had predictive value?
I believe the issue is much more complicated than it appears to be based on simple explanations. I think you are right that in many cases the variations between adjusted and adjusted data amount to noise but in other cases they may not.
Now, as far as patterns, the animation in this post shows how dividends distort them. It is the third chart down:
http://bit.ly/1WcnAXq
Michael
Carl
Hi Michael,
Do you ever sleep? Looking at your timestamps I'd have to say you are trading 7×24.
I would say that when trading dividend issues, one lives with adjusted prices either way: dividend trend drift as you articulated, or ex-dividend price suppression, as I would characterize it.
Best,
Carl
Roman
Hello Michael,
A very interesting serie of articles about dividends.
As a "Tactical Asset Allocation" investor, I confirm one of the problem mentioned in your previous article (i.e., signals changing because of the dividend drift being accumulated).
This is striking if you have an Excel sheet in which you record your trading signals and then a few months/years later if you re-run your backtest with updated data and compare it to the live signals !
Thanks a lot, your articles helped me organize my thoughts about this problem.
Cheers,
Roman
Michael Harris
Hello Roman,
One problem is that those who do not trade but only backtest do not understand the problem and treat it as another "ideological" debate.
Obviously, backtests on adjusted data take into account returns due to dividends but also distort entry and exit points. A hypothetical trader may find the variations small in many cases and defend adjusted data on the basis of taking into account the dividend stream.
However, a real trader will find the distortions annoying and realize that there is an easier way to account for dividends while using actual data.
Only for suggesting this I was attacked. It appears to me that some people are only involved with the subject of trading for "ideological" reasons, searching for a battleground to clash, and actually never trade.
Michael
George
I apologize for being ignorant the other day but instead accusing you of being one. I now understand my mistake. It is probably because I have never traded in my life and never needed to actually record trade profit/loss. I also apologize for using insults as part of my email address.
Michael Harris
Hello George,
When you actually start trading, you will realize things that are not apparent from hypothetical backtests, the type you probably do and confuse you.
Michael