

Price Action Lab was designed to work with price data but it can also be used to discover volume and indicator patterns. In this article we offer examples of how to use the program to discover volume and RSI patterns.
The steps below must be followed for discovering volume and indicator patterns with the search function of Price Action Lab (PAL):
- Replace the close column is the historical data file with volume or indicator values
- In Trade Parameters on the search workspace use “Open” as the input.
- In Search Type on the search workspace select “Close”
The above will work because although PAL will look for patterns in volume or indicator series only, the entry price is the actual open and the profit target and stop loss are calculated based on the open, high and low. The search function also ignores any open positions at the end of the historical data series. However, when using “Test Patterns” to evaluate strategies of patterns, if the last trade is open, then the results will be affected by an unrealistic closing price. This can be solved by removing the lines of data at the end of the file that correspond to the open trade.
Below are two examples from daily SPY data. The in-sample is from 01/03/2000 to 12/31/2010 and the out of sample is from 01/03/2011 to 12/31/2015. The patterns search takes place in the in-sample. PAL code for Amibroker is used and the system of patterns is evaluated on the out-of-sample and also compared to the results of the original series that include the actual close.
Note that the Amibroker code must be edited to reflect volume or the indicator function since the PAL generated code will show patterns based on close. This is easily done by editing the code and replacing “close” with “volume” or “RSI(14)” in our examples.
Before starting the search for volume and indicator patterns, we create a workspace to discover patterns based on the actual close in the in-sample for performance comparison purposes. Below are screenshots of the search workspace and the in-sample results (click to enlarge)
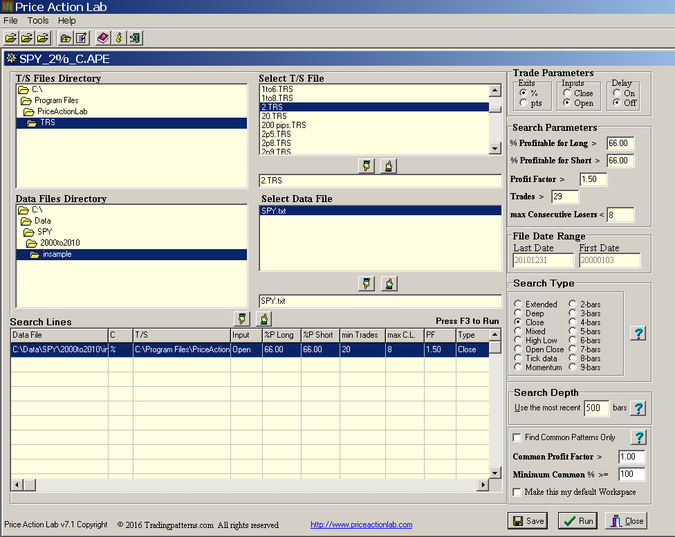 | 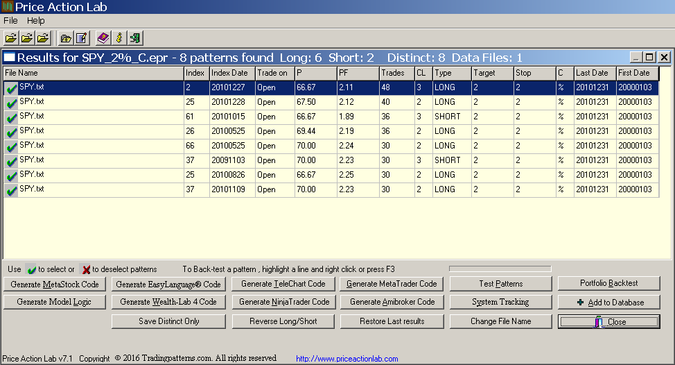 |
Pal identified 8 patterns in the in-sample that fulfilled the parameter specified on the search workplace, 6 long and 2 short. Amibroker code for a system of the 8 patterns was generated for later use.
Example 1: Volume Patterns
We created a new symbol SPYV for the in-sample and out-of-sample data and replaced close values in the data files with volume values. Below are screenshots of the search workspace and the in-sample results (click to enlarge)
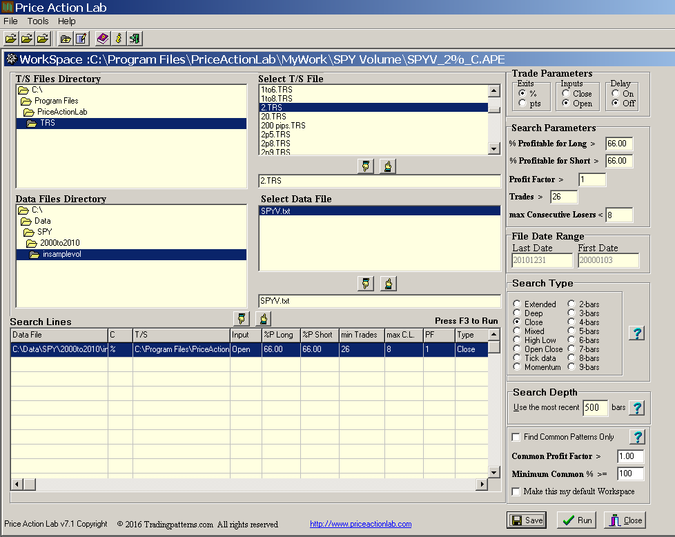 | 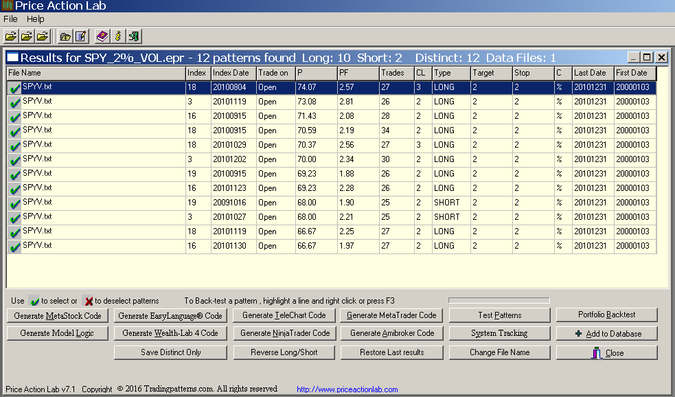 |
PAL found 12 volume patterns in the in-sample, 10 long and 2 short. Amibroker code for a system of those patterns was generated for later use. The code was then edited and all instances of “close” were replaced by “volume”.
Example 2: RSI(14) patterns
We created new data files for the in-sample and out-of-sample data and replaced close values in the data files with the corresponding values of RSI(14). Below are screenshots of the search workspace and the in-sample results (click to enlarge)
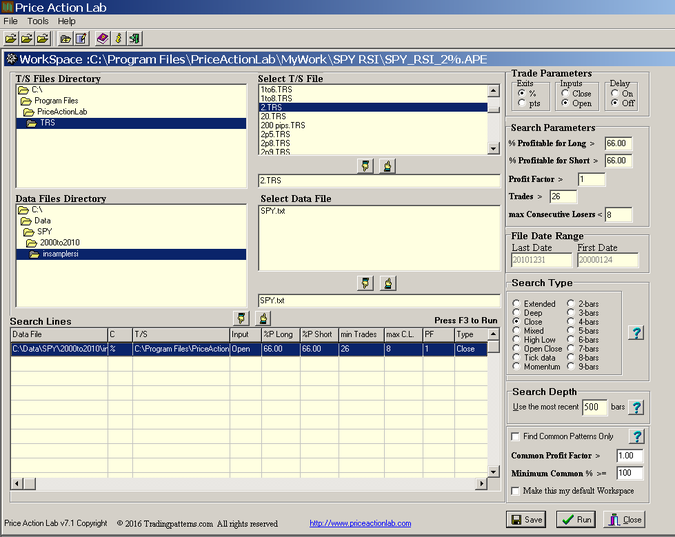 |  |
PAL found 9 RSI(14) patterns in the in-sample, 6 long and 6 short. Amibroker code for a system of those patterns was generated for later use. The code was then edited and all instances of “close” were replaced by “RSI(14)”.
Performance analysis
Note that the intention of this article is to provide examples of finding patterns of volume and indicators and not to develop a system for actual trading. Normally a lot more goes into the development process.
The performance analysis is based on data from the out-of-sample because the in-sample performance is in most cases excellent by design. The Amibroker platform was used to backtest the systems with 100K initial capital and commission of $0.01 per share. Equity was fully invested. Below is a table with performance parameters for the systems of patterns based on close, volume and RSI(14)
| Parameter | Close | Volume | RSI(14) |
| CAR | 2.95% | 4.59% | -0.82% |
| Sharpe | 0.36 | 0.59 | -0.1 |
| Max. DD | -13.2% | -14.2% | -16.4% |
| Win rate | 54.6% | 56.8% | 50% |
| Trades | 88 | 81 | 84 |
| Losing yrs | 2 | 2 | 3 |
Note that the performance of the system based on volume is better than the performance of the system based on close. The performance of the RSI(14) system is random with win rate 50% and slightly negative Sharpe ratio.
Next, we combine the volume patterns with the close patterns, and the RSI(14) patterns with the close patterns, to analyze how the combined systems behave as compared to the system based on the actual close:
| Parameter | Close | Close+Volume | Close+RSI(14) |
| CAR | 2.95% | 3.62% | 3.40% |
| Sharpe | 0.36 | 0.37 | 0.36 |
| Max. DD | -13.2% | -15.2% | -14.3% |
| Win rate | 54.5% | 52.8% | 51.8% |
| Trades | 88 | 125 | 139 |
| Losing yrs | 2 | 2 | 1 |
Both combinations show improved performance over the system based on the close. Apparently, the improvement is better for the close+RSI(14) system with only one out of the five years in the out-of-sample showing negative performance.
Conclusion
The intention of this article was to show how to use PAL to discover patterns of volume and indicators. The results were based on a particular time period and security and for this reason they cannot be generalized. PAL provides the capability for developing systems based on patterns of OHLC and also of volume and indicators but all results should be carefully evaluated.
Subscribe via RSS or Email, or follow us on Twitter.
Charting and backtesting program: Amibroker
Disclaimer


