

This article is about a long/short equity strategy developed with DLPAL LS. The large sample and the exceptional performance during the 2008 bear market demonstrate the predictive power of the features generated by DLPAL LS for developing institutional grade strategies as well as their importance for hedge funds.
In a recent article we offered a brief introduction to long/short equity strategy development with DLPAL. Below is a quote from that article:
“Long/short equity strategies involve taking both long and short positions so that a net profit is made while market exposure is minimized. If the strategy is designed properly, then usually during bull markets long positions tend to be more profitable than short and the other way around during bear markets. Therefore, the profitability of a long/short strategy does not depend on market direction.”
DLPAL LS software offers a unique capability of calculating historical values of four indicators (also called features, attributes or predictors in machine learning) using the historical data for each stock in a universe of any size. The frequency of the data is usually daily but it can also be weekly. Long/short equity signals are then generated based on the values of the four indicators, PLong, PShort, Pdelta and S, or any combination of them. More details about these indicators can be found in the program manual.
The historical data files of the indicators can be imported in a backtesting platform for developing and testing long/short strategies. In this article we consider an example involving a universe of 28 Dow stocks (V and GS are not included) and the history for the features starts in 01/2006.
Update on 06/20/2018: Click here.
Update on 04/16/2019: Click here (strategy based on fixed rules.)
Update on 04/26/2019: Click here.
Historical file generation
The historical features files were generated by DLPAL LS, an institutional grade version of DLPAL software.
The DLPAL LS software takes the original historical data files of the stocks and creates a new set of files with extension .pih that include the feature values for each instance (row). An example is shown below for AXP.
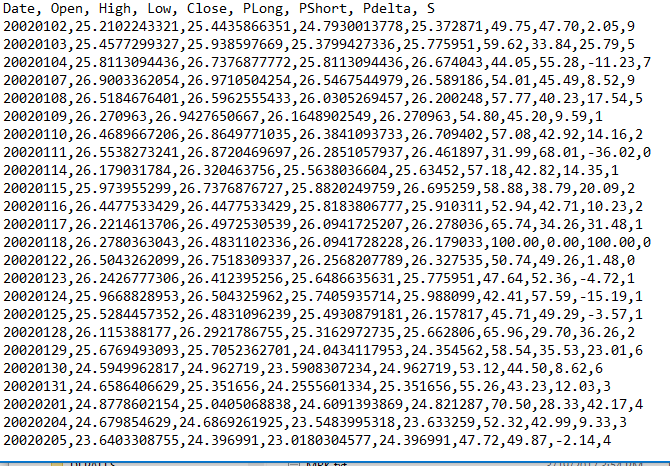
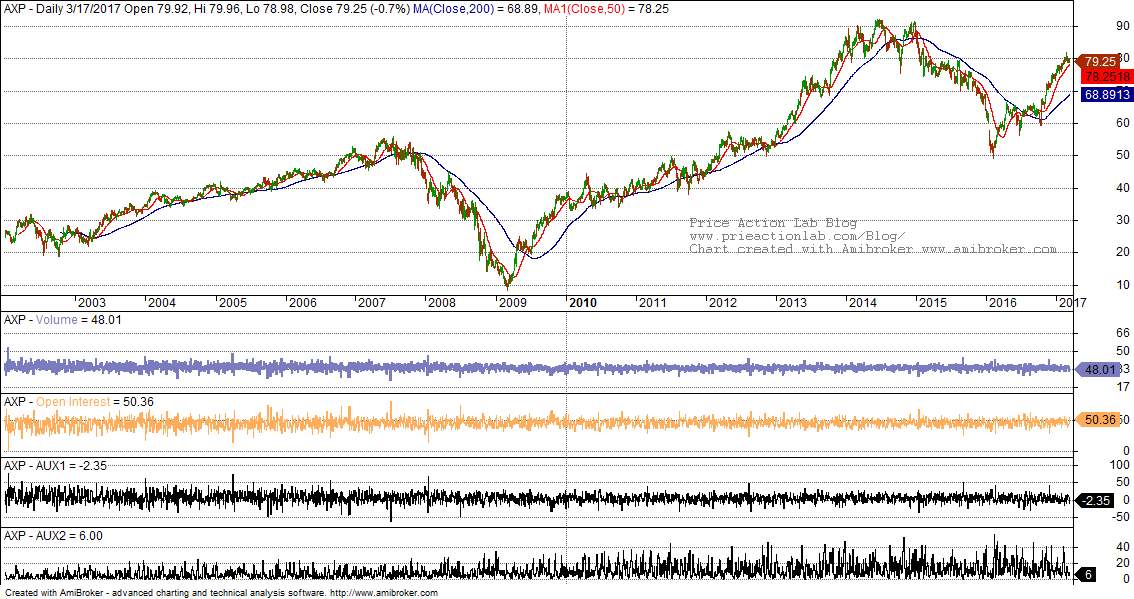
The .pih files are then imported in a trading platform. Here we use Amibroker because it offers advanced portfolio backtesting and analysis capabilities in addition to the ease of importing historical data with additional fields. The four features are imported as follows: PLong is assigned to Volume, PShort is assigned to Open Interest, Pdelta is assigned to AUX1 and S to AUX2. A typical chart of the stock with the features is shown below.
Long/Short strategy
Time-frame: Daily (adjusted data)
Strategy type: Long/short equity
Universe: 23 Dow stocks from current composition
Backtest period: 01/03/2006 – 03/17/2017
Maximum open positions: 20
Commission per share: $0.01
Position size per stock: Equity/20
Position entry and exit: Open of next bar
Strategy logic
Although there are several options, including the use of machine learning classifiers in the case of more advanced models, here we use AUX1 and AUX2 indicators as follows.
Buy = Cover = AUX1 × AUX2 > 0
Short = Sell = AUX1 × AYX2 < 0
Strategy performance
| Parameter | With comm | No comm | Buy and Hold |
| CAGR | 6.35% | 9.14% | 8.04% |
| Max. DD | -14% | -14% | -55% |
| Sharpe | 0.61 | 0.88 | 0.37 |
| MAR | 0.45 | 0.66 | 0.15 |
| Win rate | 52.5% | 53.1% | – |
| Trades | 22732 | 22732 | – |
| Profit factor | 1.09 | 1.13 | – |
| Payoff ratio | 0.99 | 1,00 | – |
It may be seen that there is significant reduction in CAGR from 9.14% without commissions to 6.35% after commissions. This is expected due to the large sample of trades. However, even after commissions, strategy Sharpe and MAR are significantly higher than those of buy and hold.
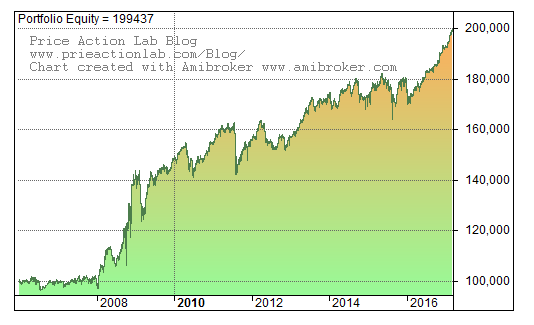
Below are the equity curve, underwater equity curve and monthly returns table. (Click on images to enlarge.)
 |
 |
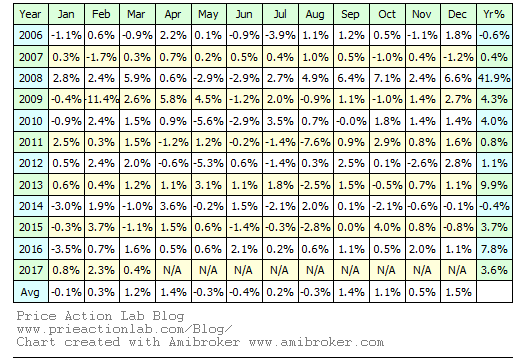 |
A 41.9% return for 2008 demonstrates the importance of long/short equity strategies during times of stock market turmoil. Even if this theoretical figure is reduced by 50% to account for slippage and missed trades due to lack of short inventory, the equity performance is still significant given buy and hold drawdown.
Below is a Monte Carlo simulation graph.

The probability of a max drawdown greater than 17% is 1%, according to the simulation. This is pretty good.
Conclusion
The results in this article demonstrated at least two things:
(1) There is potential for significant edge in the indicators developed by DLPAL LS
(2) Long/short equity strategies have the potential of generating significant alpha during major stock market downtrends even if cost due to friction is high.
For more articles about DLPAL LS click here. More details about ordering a trial can can be found here.
Update on 06/20/2018: Click here.
If you have any questions or comments, happy to connect on Twitter: @priceactionlab
Strategy performance results are hypothetical. Please read the Disclaimer and Terms and Conditions.
Charts were created with Amibroker – advanced charting and technical analysis software. http://www.amibroker.com


