


A few charts and lessons from the most dramatic crash in the history of the stock market, actually a 25-sigma event as shown below. Revised on October 16, 2022.
I was starting graduate school at Columbia University when the stock market crashed on October 19, 1987. This was a shocking event for the simple reason that, as shown in the chart below, the largest one-day drop in S&P 500 from 01/1960 to 10/16/1987 was 6.7% on May 28, 1962. Possibly few expected more than a 10% drop in S&P 500 on a single day.
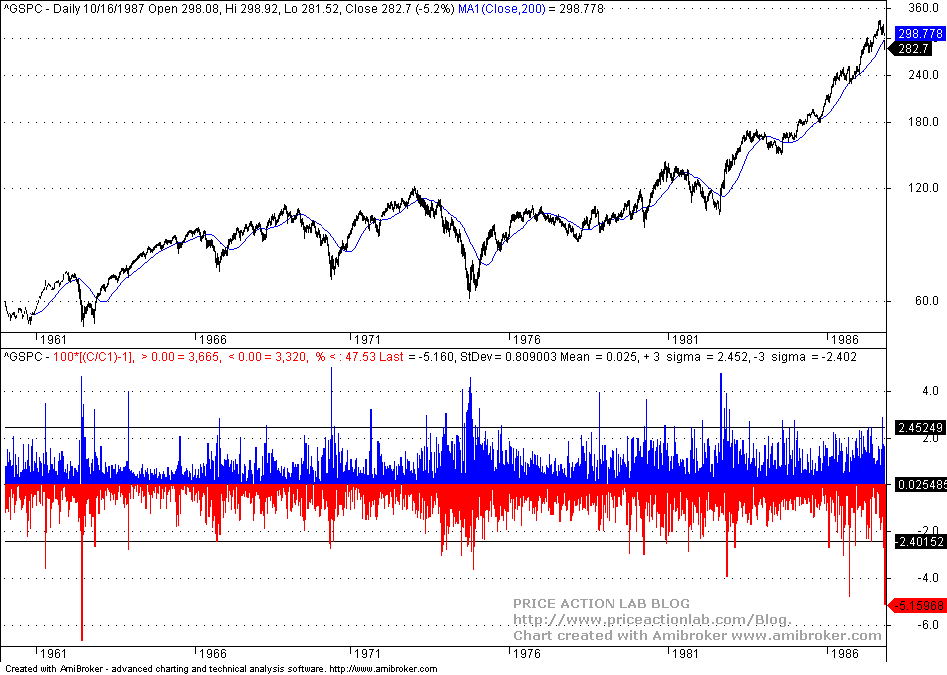
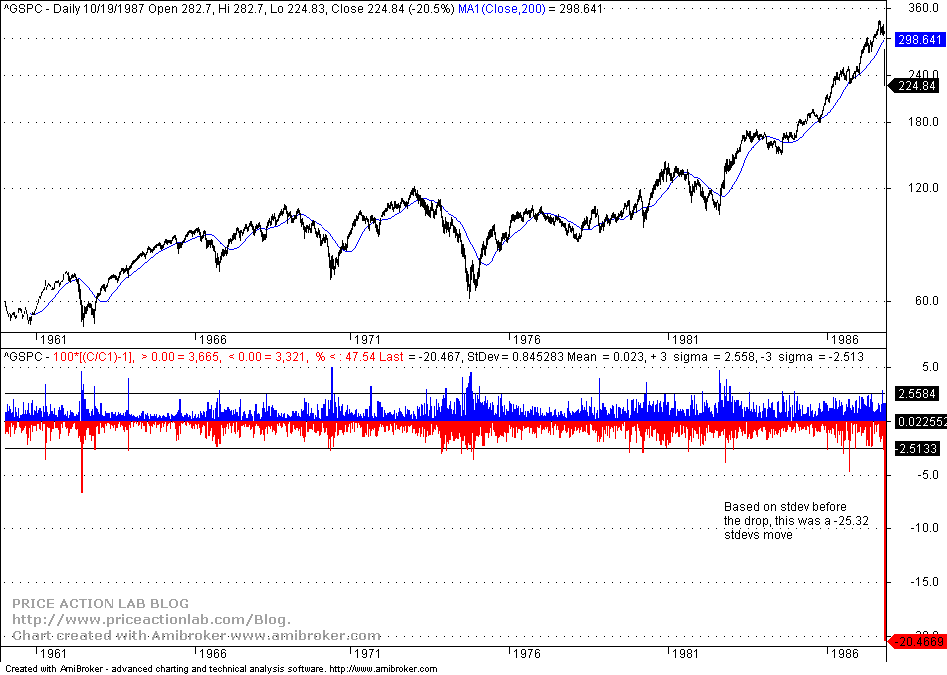
Note that the standard deviation of daily returns before the crash was 0.809%. Not that it makes a fundamental difference but many refer to the 1987 crash, a -20.5% daily drop, as a 20-sigma event based on a returns series that includes it. However, if one uses the series of returns before the crash, then it turns out it was a 25-sigma event, as shown below.
An unexpected event of this kind had catastrophic consequences for many market participants. But why did it happen?
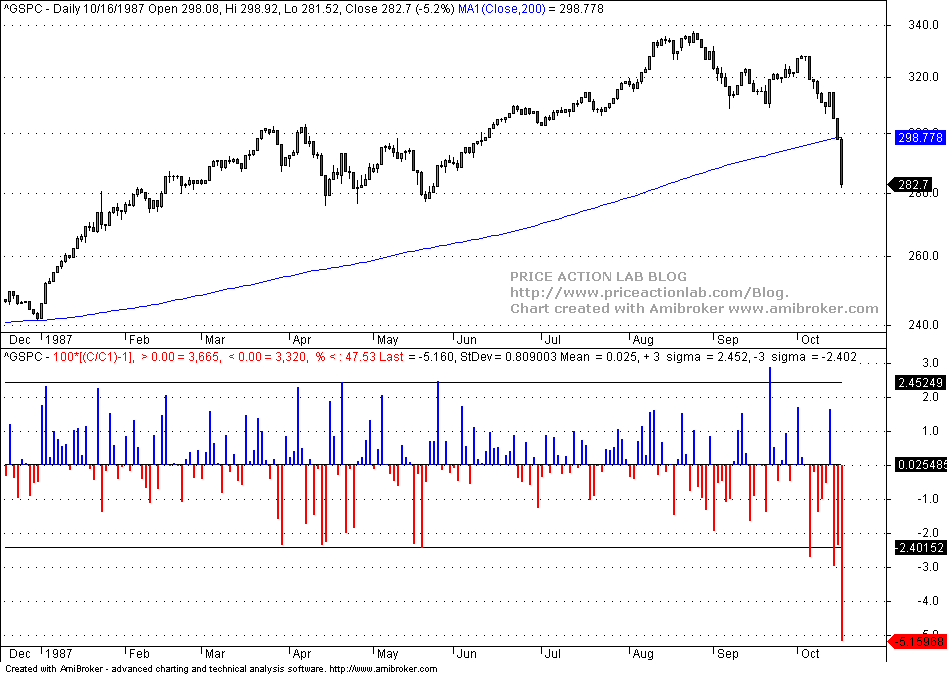
Many blame this crash on a chain of events related to economic policy uncertainty and also on program trading. However, the connection between the crash and these factors is too loose because they have occurred before and several times afterward without causing a crash. In my opinion, this event occurred because market participants panicked when the index fell more than 5% below the 200-day moving average the day before the crash, as shown in the chart below. The move was perceived as too violent and there was a stampede to get out the following Monday, as shown in the above chart.
Note that during that time there was a TV network dedicated to financial news and there was also competition between various analysts about the best forecasting tools, when in fact no one had anything but random noise. Some analysts in that popular financial network had elevated the 200-moving average to the mother of all indicators. Investors panicked when they saw the fierce violation of this popular indicator on October 16, 1987, as shown in the chart below, and thought a 10% correction was coming, or another 5% was definitely in the cards.
As a result of a stampede to get out, the actions of the market participants caused a black swan event in the form of a 20.5% drop, or an unthinkable 25-sigma drop.
The lessons
- The event (as first argued by N. N. Taleb) was not an outlier.
- These events can occur if there is sufficient panic.
- The major cause was not program trading; that was an effect of the panic.
- The impact of unexpected events depends on the timeframe under consideration.
- All leveraged investors and traders reached uncle point on that day.
Note that it took about two years (October 20, 1987, to July 26, 1989) to regain the previous high of August 25, 1987. Also, note the peculiar fact that it is hard to determine from the yearly chart that this catastrophic event ever occurred.
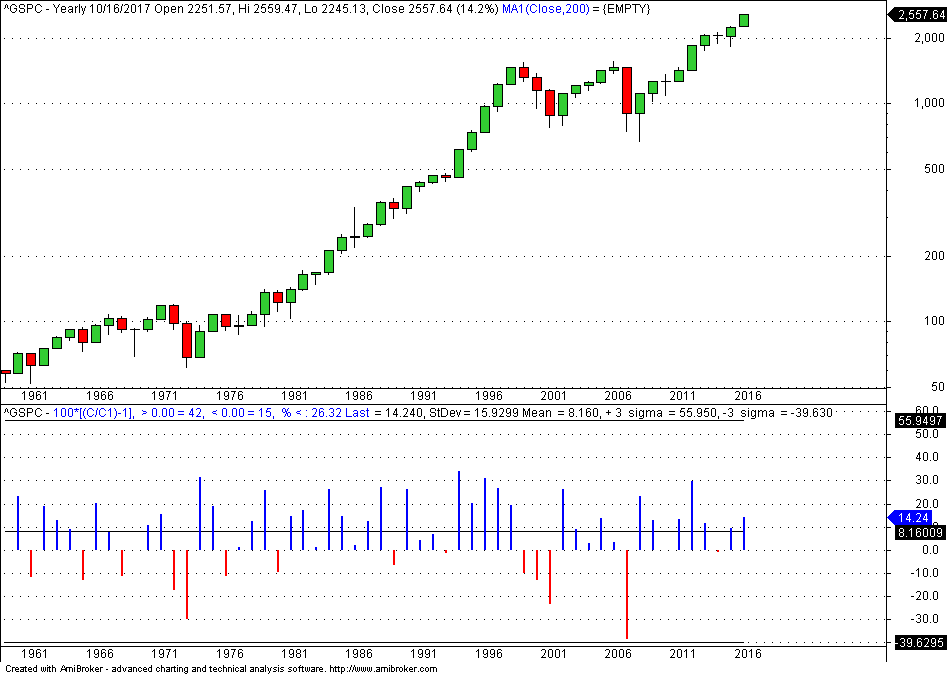
The S&P 500 finished 1987 with a gain of about 2% before dividends. Yearly charts can be misleading in this context. Note that the 2008 bear market offered plenty of time for trend-followers to get out but it shows as a highly negative year. However, the 1987 crash occurred immediately after prices moved below the 200-day moving average. On the other hand, unleveraged investors that balance their portfolios annually and do not even bother with daily fluctuations were not affected although this is theoretical because everyone may be affected by the news media.
As a graduate student during that time, these lessons were invaluable to me. When I started trading I used little or no leverage and frequently purchased cheap insurance in the form of OTM puts or calls depending on the direction of trades, long or short. I also started paying more attention to statistical analysis and especially to tail events.
Charting and backtesting program: Amibroker
If you found this article interesting, you may follow this blog via push notifications, RSS or Email, or on Twitter


