


Everyone has heard of volatility drag and how it negatively impacts compound returns. However, very low volatility can also have a detrimental effect on growth. Below are some examples.
Everyone understands that if there is a loss of 50%, then a gain of 100% must be realized to break even. High volatility imposes a drag on equity growth. The volatility drag is the difference between arithmetic and compound return but this is only an approximation that is useful for all practical purposes. As the volatility drag increases, compound returns decrease and may even get negative.
However, there is rarely a reference to the low volatility drag on returns possibly because risk of ruin is lower. As I will demonstrate below with examples, low volatility drag can be more detrimental than high volatility drag.
For this study, we set all daily arithmetic returns higher than +2% and lower than -2% to +2% and -2% relatively, and all negative daily arithmetic return larger than -0.5% to -0.5% and all positive arithmetic returns smaller than +0.5% to +0.5%. Therefore, If Ri represents the daily arithmetic return, the transformations are as follows:
- If Ri > +2% then Ri = +2%
- If Ri < -2% then Ri = -2%
- If Ri > 0 and Ri < +0.5% then Ri = +0.5%
- If Ri < 0 and Ri > -0.5%, then Ri = -0.5%
Case 1. SPY since inception to 12/20/2017
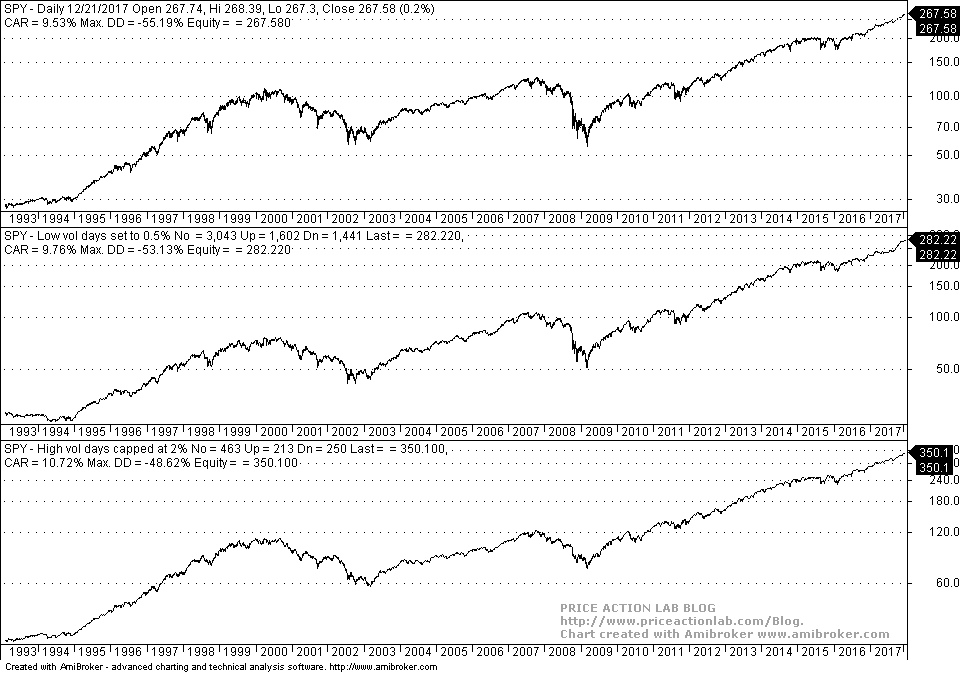 The first pane shows the evolution of prices after setting low volatility returns to ±0.5% and the second pane the evolution of prices after setting high volatility returns to ±2%. The results confirm the impact of high volatility drag. Without high volatility prices would have been at 350.10 versus the current 267.58. But without low volatility price would have been still higher at 282.22 but not as high as 350.10. Therefore, both low and high volatility impact prices negatively but in this case high volatility has a more negative effect.
Case 2. S&P 500 index from 01/02/1961 to 12/20/2017
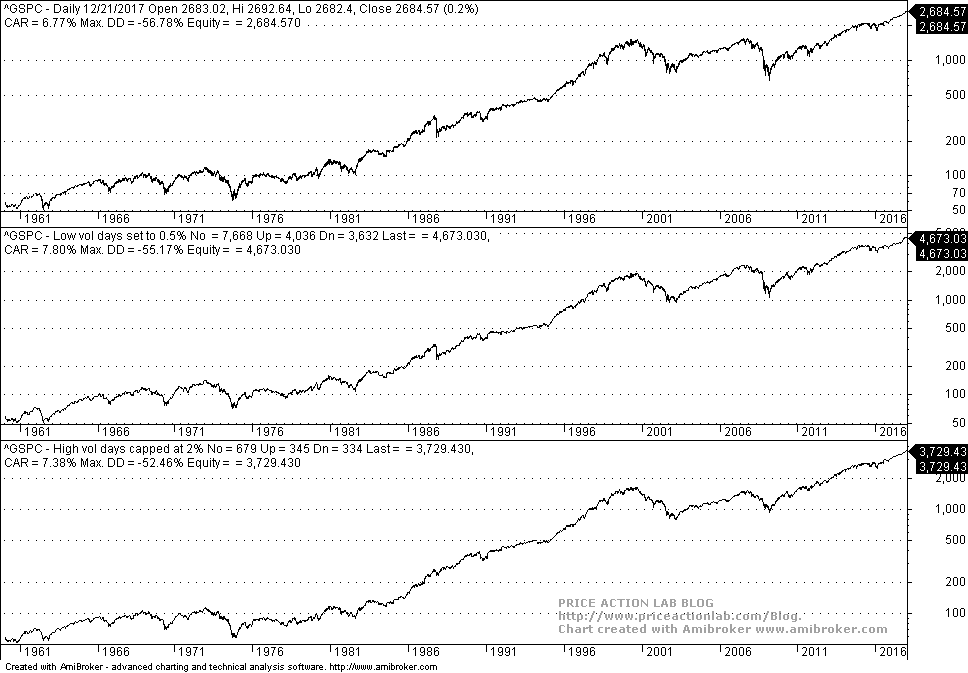
This is now getting interesting: removing low volatility has a more positive effect than removing high volatility. Specifically, by setting all low volatility daily returns to ±0.5%, price growth is much higher along with CAGR as compared to capping high volatility daily returns to ±2%. The index would have been at 4,673 if with some magical way all low daily changes were set to ±0.5% versus a 3.729 if the magic was used to cap large daily returns at ±2%.
Note that in both cases price is higher but we are interested in relative performance. In the case of the S&P 500 it appears the low volatility drag has been more pronounced than high volatility drag.
The relative difference of the impact of low and high volatility drag depends on the distribution of returns. However, in most academic papers and in articles the impression left is that (high) volatility drag has a more pronounced effect. As I show here, this is not always the case. This can also be seen from the NASDAQ chart:

Price and CAGR after removing low volatility are higher than when capping high volatility. However, this does not hold for NASDAQ-100:
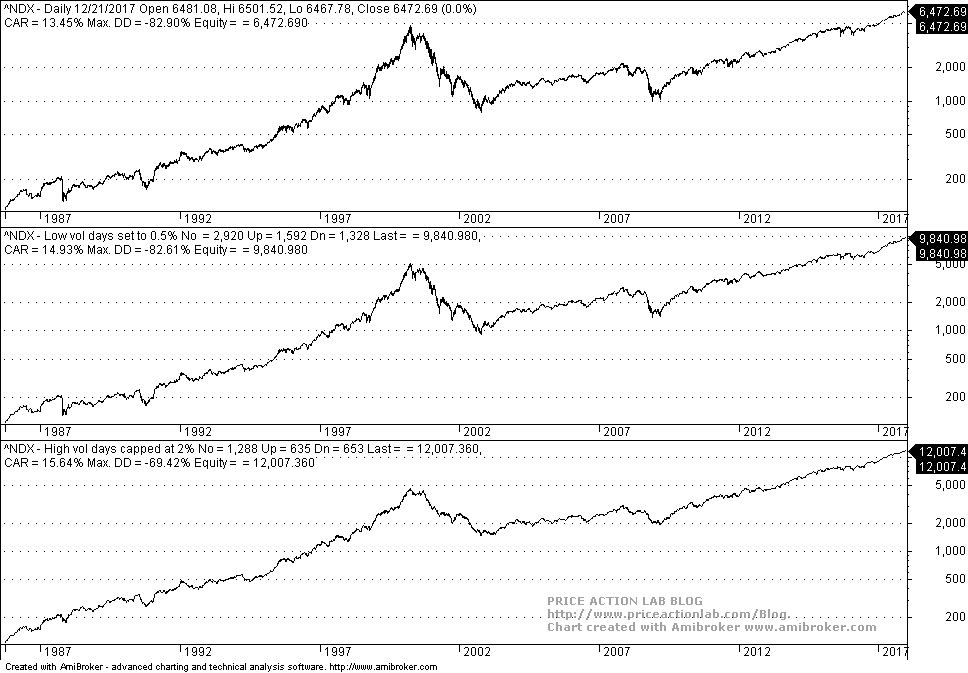
In this case high volatility drag is much more pronounced than low volatility drag and removing high volatility results in a much higher price and CAGR but also at a much lower maximum drawdown as may be seen from the chart above.
The conclusion is that low volatility can be a worse drag then high volatility in some cases. The relative difference depends on the distribution of returns but also on their sequence of occurrence in the time domain. But in general, assuming that volatility drag is related only to high volatility may not be a correct assumption. Markets are more complicated than the simple formulas finance and economics use. Drawing conclusions about highly non-linear stochastic processes from simplified models has helped many people in getting advanced degrees, securing tenure or publishing papers and books but reality is much more complicated than that as practitioners and others with skin-in-the-game know.
If you found this article interesting, I invite you follow this blog via any of these methods: RSS or Email, or follow us on Twitter
If you have any questions or comments, happy to connect on Twitter: @mikeharrisNY
Charting and backtesting program: Amibroker
Quantitative analysis of Dow-30 stocks and 30 popular ETFs is included in our Weekly Premium Report. Market signals for longer-term traders are offered by our premium Market Signals service. Mean-reversion signals for short-term SPY traders are provided in our Mean Reversion report.


