


My New Year’s resolution is to stop listening to biased analysts. Here is a brief recap and a recent example of an “ominous indicator.”
- In 2010 we were told by renowned economists QE will cause hyperinflation
- In 2013 we were told that the end of QE will be followed by a market crash
- In last 7 years a widely followed website has called for numerous market crashes
- The famous indicators that predicted Dow will never make it above 20K
- The Brexit catastrophe that never came and it was actually the inverse
- The “If he is elected, this is the end of the market” meme
- The wedges, head and shoulders and triangles that predicted bear markets (!)
Aren’t you tired of this biased analysis like I am? There is no indicator that will forecast when the market is going to crash, not even one. Most click-bait schemes and naive analysts use selection bias to support their thesis. Even those who say that the market will go up are in most cases charlatans since the odds are way in favor of an uptrending market. So what are we doing? Let us stop following these biased analysts.
Below is a chart of the 252-day correlation between the Dow and S&P 500.

Here you go, an ominous indicator, the end of the market, I could have used this as a title if my objective was this article to find its way to MSM. The correlation has plunged recently as it did before the 2000 top. A crash is coming?
But wait, I was selective here, just like those numerous biased analysts. If we scroll the chart a little towards the past this is what we get:
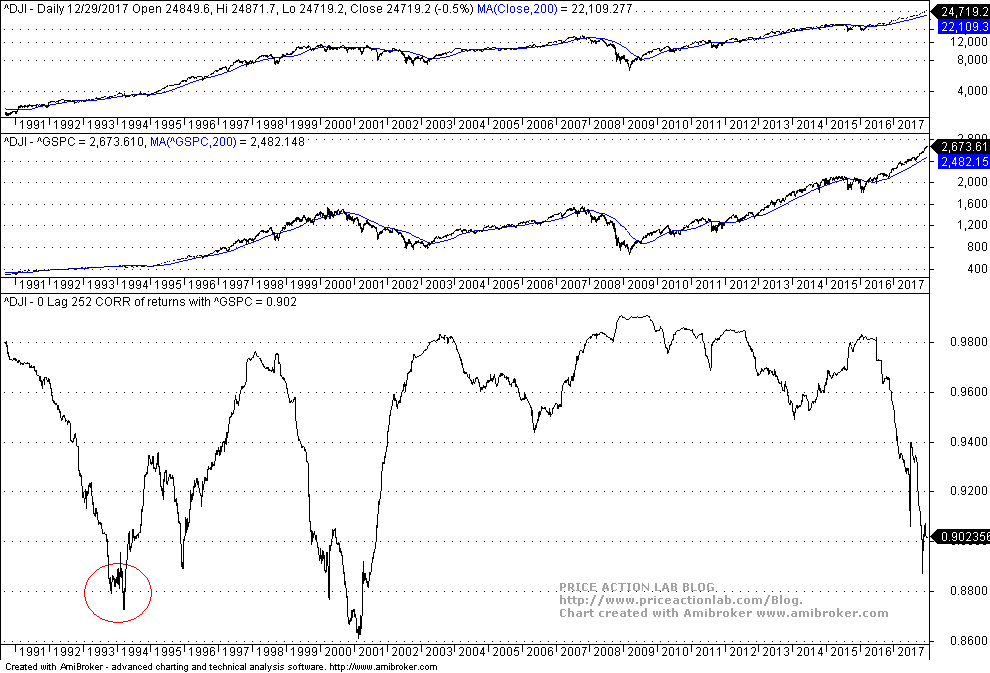
The same correlation also plunged in 1994 before one of the longest rallies in the history of the stock market.
No, it is not one possibility against the other. The answer is that these indicators are worthless, especially ones based on correlations because they have little relation to causality. But ALL indicators are acausal. This is why they are called indicators and not laws of nature. They indicate things but they do not predict anything with certainty. The margin of error is usually so large that most indicators used to forecast major events are useless.
Anytime you see a chart with an ominous sign, be skeptical: is it possible that the one who created it is hiding something in order to serve some bias? In most cases this is the case. I saw another article the other day that claimed high intraday buying of dips activity lately based on some charts. What was amazing is that I asked the person that posted the chart in Twitter and he did not know how the chart was created. Actually, I could not find any reference of it in Google.
Finally, be very wary of extraordinary returns in the stock market. Any compound annual return higher than 12% or 13% in backtests is usually suspicious and could be due to look-ahead bias or relentless over-fitting. This has been a problem even of seminal publications in trend-following and an error committed by an active-in-social-media fund manager who appears not to understand the perils of backtesting.
This is one of my Axioms about market analysis:
Analysts that do not try to impress their audience are usually the most capable and knowledgeable in their business.
If you found this article interesting, I invite you follow this blog via any of these methods: RSS or Email, or follow us on Twitter
If you have any questions or comments, happy to connect on Twitter: @mikeharrisNY
Charting and backtesting program: Amibroker
Quantitative analysis of Dow-30 stocks and 30 popular ETFs is included in our Weekly Premium Report. Market signals for longer-term traders are offered by our premium Market Signals service. Mean-reversion signals for short-term SPY traders are provided in our Mean Reversion report.


