


The bulk of classical technical analysis charting is based on confirmation bias: chartists look for patterns that confirm expectations tied to future economic conditions. But biased analysis is wrong more often than it is right. A recent example is included.
There are high expectations of rising interest rates. The Fed has provided forward guidance about rates. This means bond yields may probably rise. I say maybe because I have been in this business for 25+ years and I have seen wide divergences between expectations and reality. One example no one should ever forget is the economist consensus in the 2011 – 2012 period that quantitative easing will cause a surge in inflation and high bond yields. Pundits appeared on financial TV daily predicting a bond market crash. Some believed them and paid the price.
Classical technical analysts were trying hard during that time to identify a pattern in bonds that would confirm the economist bias of a market plunge. They finally found one, a complex head and shoulders top in bond prices. They were excited about financial and social media when making references to this pattern. I included this one in my book Fooled By Technical Analysis for TLT ETF as it is shown below:
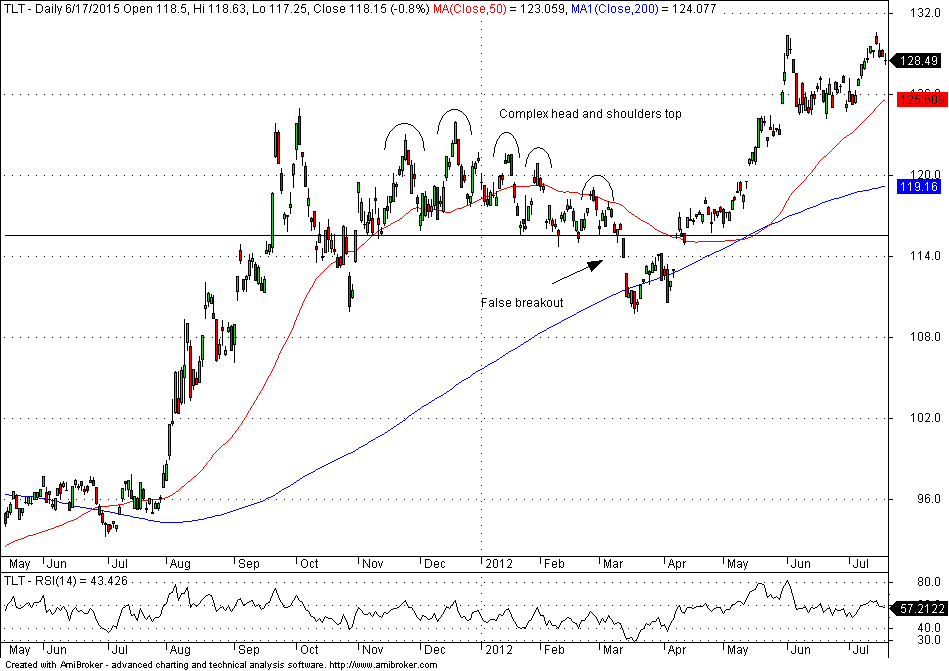
For some hedge fund managers, this seemed like an opportunity of a lifetime because as it has been shown the bulk of CTA profits have been generated in the bond markets. After a brief confirmation of the complex top prices reversed, causing heavy damage to bond shorts.
The recent confirmation bias has taken the form of a head and shoulders pattern in the S&P 500 /10-Year Note yield ratio chart, as shown below:
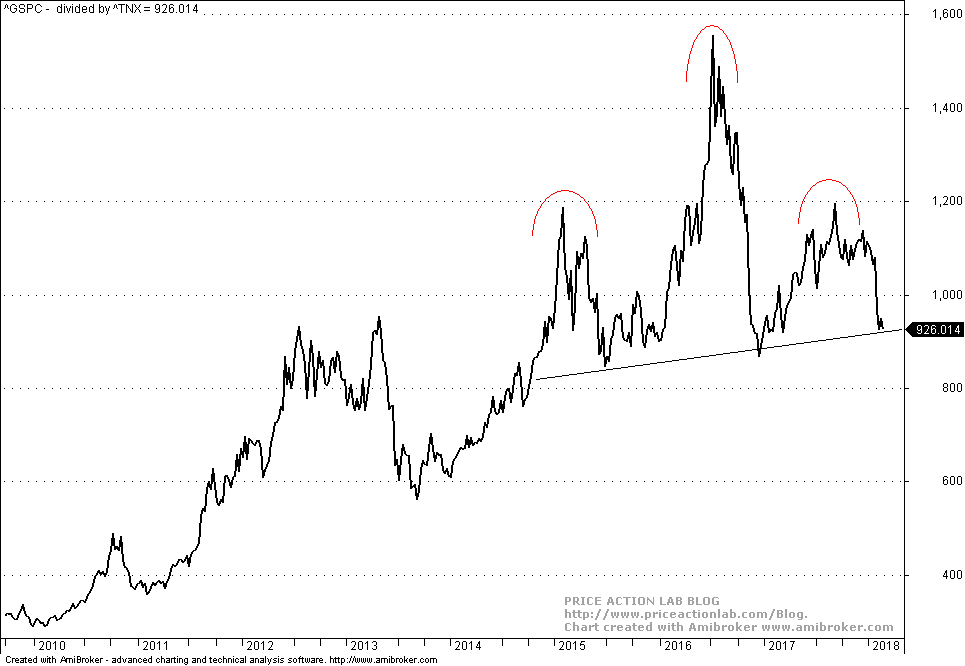
The story sold to the public goes as follows: If there is confirmation of this pattern, then stocks will fall or if the pattern fails, stocks will rise.
Is there anyone who does not understand that stocks will rise or fall?
Save the fact that if the pattern is confirmed, it means that stocks fell already provided that yields stayed constant or rose.
There is of course the possibility that the pattern is confirmed but stocks and yields go higher. How? Stocks gain little but yields surge. This is a low probability scenario but possible.
Why are people still involved in this type of technical analysis that is indistinguishable from astrology?
The answer is because it is simple and there is the availability heuristic bias: simple explanations to complex problems are popular within a network of people because other people have accepted them.
This chart analysis leads nowhere. Waiting for patterns to form over three years and insisting that they are not random but carry useful information is a big leap of faith. But the TA-astrologers find an audience because showing patterns is easier than showing math formulas.
But trading nowadays is math and computers. Below is a picture of a group of modern traders:

As long as there are people who look for simple patterns on charts, HFT traders and other professionals will be making profits. There is no incentive to educate anyone, actually, the opposite pays, i.e., financing those who promote random market decisions.
Charting and backtesting program: Amibroker


