


When a significant change to Dow composition is made, this could be a leading indicator of a bear market as the available limited sample shows and this goes against popular beliefs that changes to the index are made to maintain uptrends.
By a significant change in this article I mean three or more changes in the composition of the Dow at any given time. Note that nothing implies causation is this article. Changes may be due to changing economic regimes or an attempt to prevent an index decline but causality cannot be established.
The chart below shows daily Dow prices from 1914 to 2/27/2018. The first indicator shows the number of changes in the index composition, the second indicator shows the cumulative number of changes and the third indicator is the 2500-day (about 10 years) rate of change of the index.
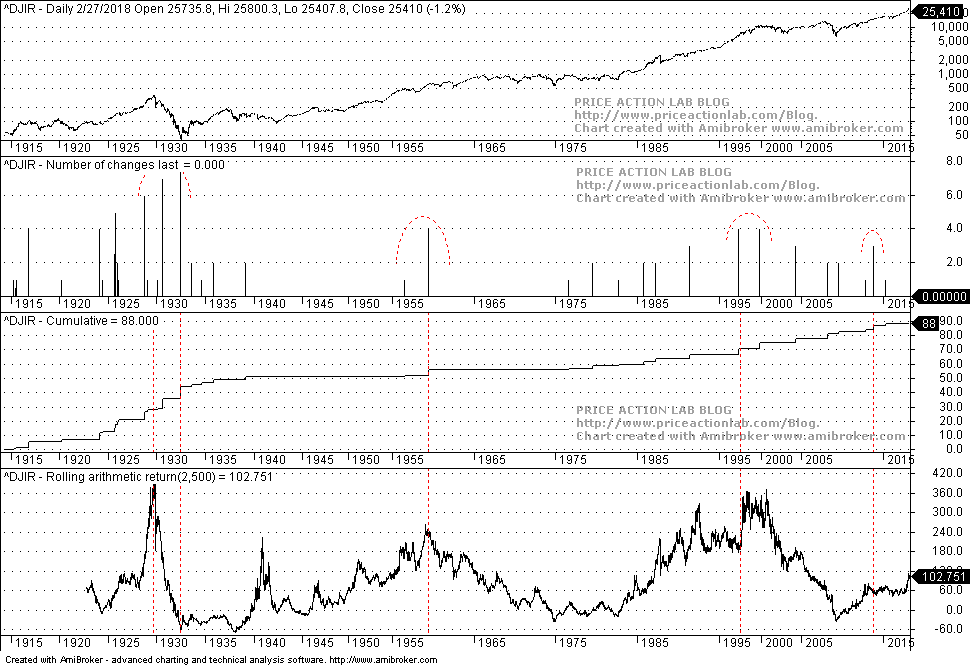
The vertical red dotted lines show periods when the 10-year return fell below zero after a significant change in index composition. There are two such periods due to the Great Depressions, one in the 1950s, and another in the late 1990s due dot com crash. The significant changes in the 1980s and 2000s are not marked because the 10-year return did not fell towards zero. The last significant change in 2013 is also marked and the outcome of this may be still undecided.
What I find interesting from the above chart is that despite the major changes in the composition of the Dow in the 1990s, the bear market was not averted as it was also the case in the previous two major changes in the 1950s and before and during the Great Depression. Since I have a feeling that major changes to the index may be announced in the near future, with Alphabet, Amazon and Facebook being the primary candidates for inclusion, that would be a signal of a bear market and negative 10-year returns to follow despite popular misconception that changes to the index are made to maintain the uptrends. In other words, I am a contrarian based on the above chart.
If you found this article interesting, I invite you to follow this blog via any of these methods: RSS or Email, or follow us on Twitter
If you have any questions or comments, happy to connect on Twitter: @mikeharrisNY
Charting and backtesting program: Amibroker
Quantitative analysis of Dow-30 stocks and 30 popular ETFs is included in our Weekly Premium Report. Market signals for longer-term traders are offered by our premium Market Signals service. Mean-reversion signals for short-term SPY traders are provided in our Mean Reversion report.


