


In this article we include an example of using DLPAL S software to discover volume patterns. The patterns are identified in the in-sample and then tested out-of-sample.
Below are the two steps that must be followed in order to discover volume patterns with DLPAL S:
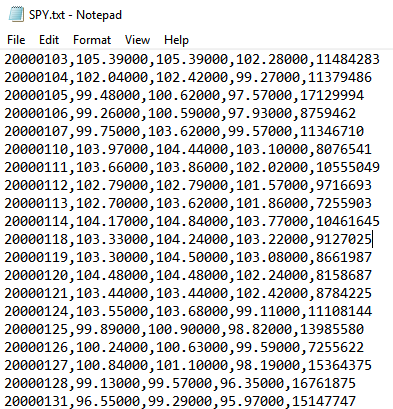
1. Replace the close field is the historical data with the volume field
The required format is: Date, Open, High, Low, Volume
This is how a a data file will look like:
2. In Trade Parameters on the search workspace use “Open” as the input and then select the “Close” Major Feature Cluster only. Below is an example of a workspace.
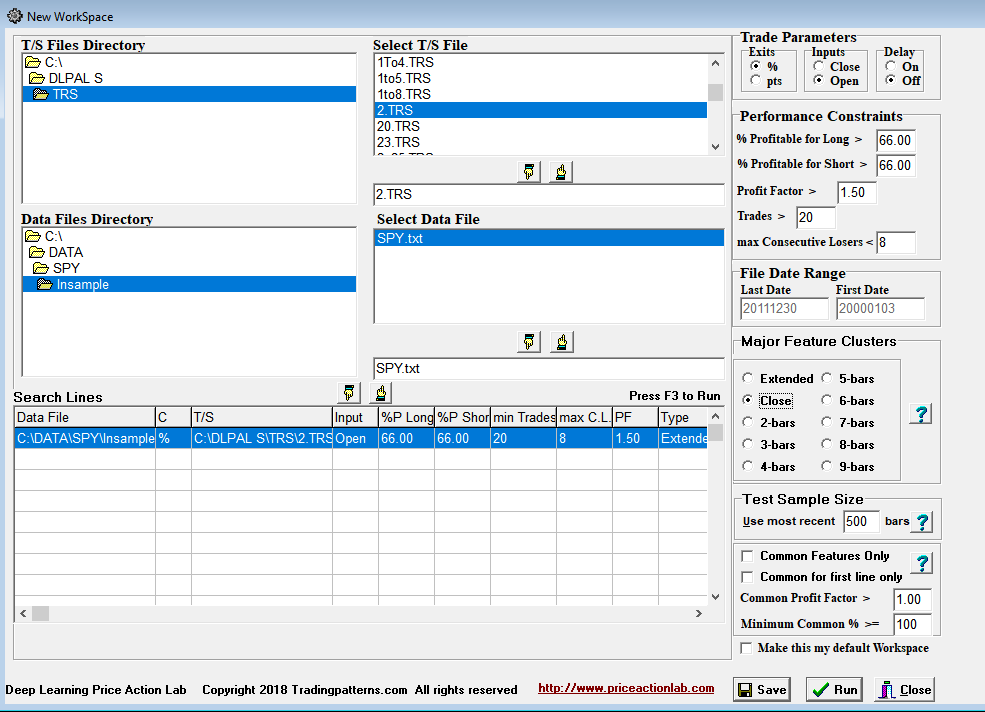
The modified data are stored and directory \DATA\SPY and then we used the Data Partition tool to create in-sample and out-of-sample. The in-sample covers the period 01/03/2000 to 12/30/2011 and the out-of-sample goes from 01/03/2012 to 05/07/2018.
Please note that we have left all other parameters on the workspace at default values. Our objective here is to show how to discover volume patterns and not to develop a robust trading strategy. In addition, the same procedure and steps can be used to discover indicator patterns by replacing the close values with the values of the indicators. One must be careful to avoid look-ahead bias in that case. Therefore, the indicator values must be calculated up to the date specified in each instance in the file.
The steps outlined above are sufficient since DLPAL S will look for patterns only in the volume data but then use the open price for entering trades and the high and low for determining profit targets and stop-loss exits (also the open in case there is a gap.) Therefore, the values in the TRS file used correspond to changes in price, not volume. The algorithm also ignores any open positions at the end of the historical data series. However, when using “Test Strategies” to evaluate strategies of patterns, if the last trade is an open trade, then the results will be affected by an unrealistic closing price that is actually a volume. This can be solved by removing the lines of data at the end of the file that trigger the open trade.
Results
Below are the results obtained for the in-sample:
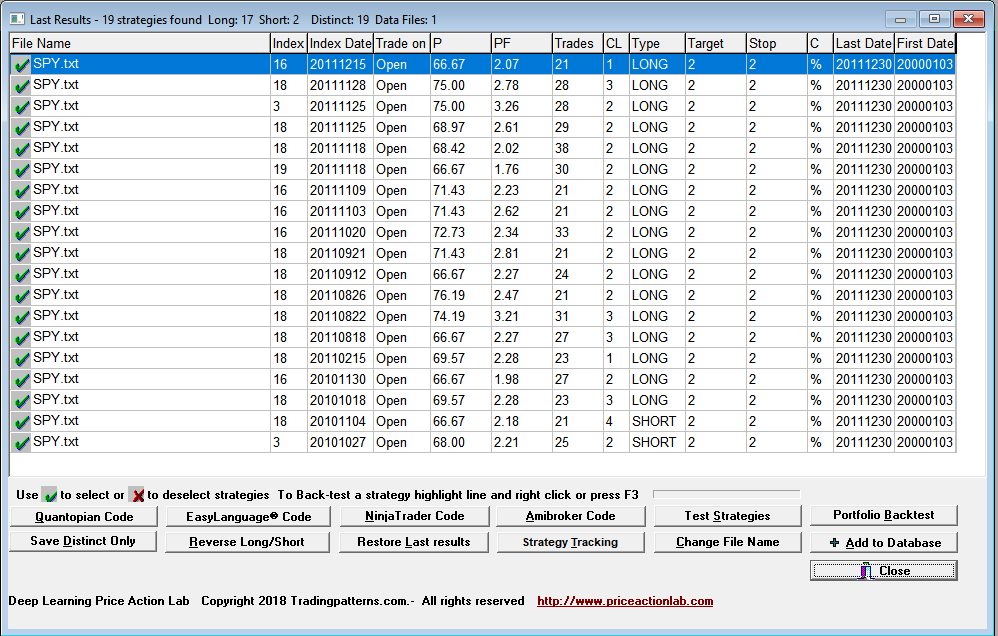
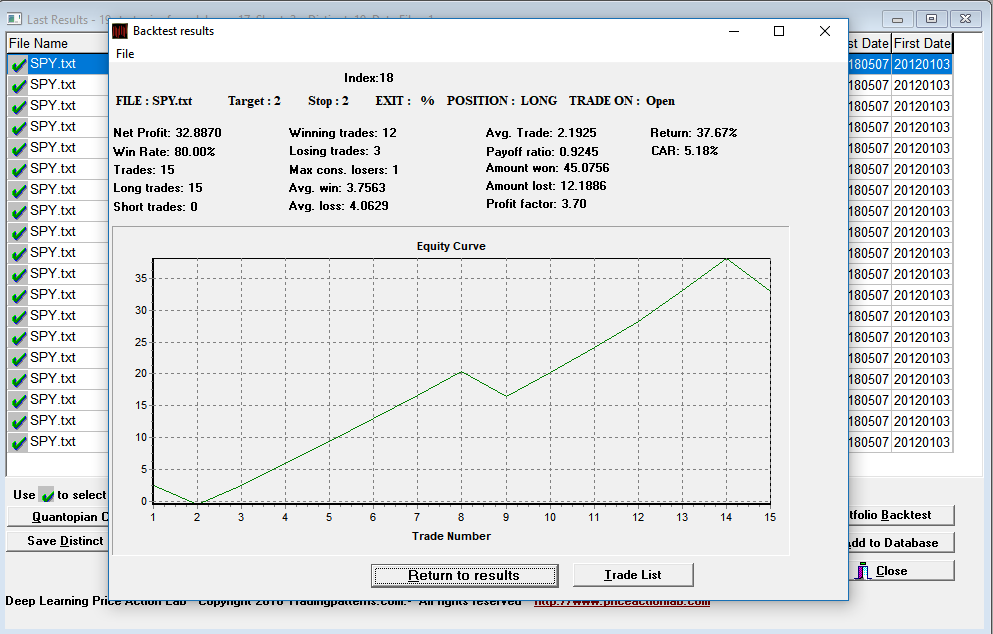
For the particular setting used in the workspace above, the results included 19 patterns, 17 long and 2 short. Below is a backtest of the most profitable pattern in out-of-sample.
Amibroker backtest
The Amibroker code must be edited to reflect volume since the DLPAL S generated code will show patterns based on close. This is done by editing the code and replacing “close” with “volume”. Below are the results (no commissions or slippage are included.)
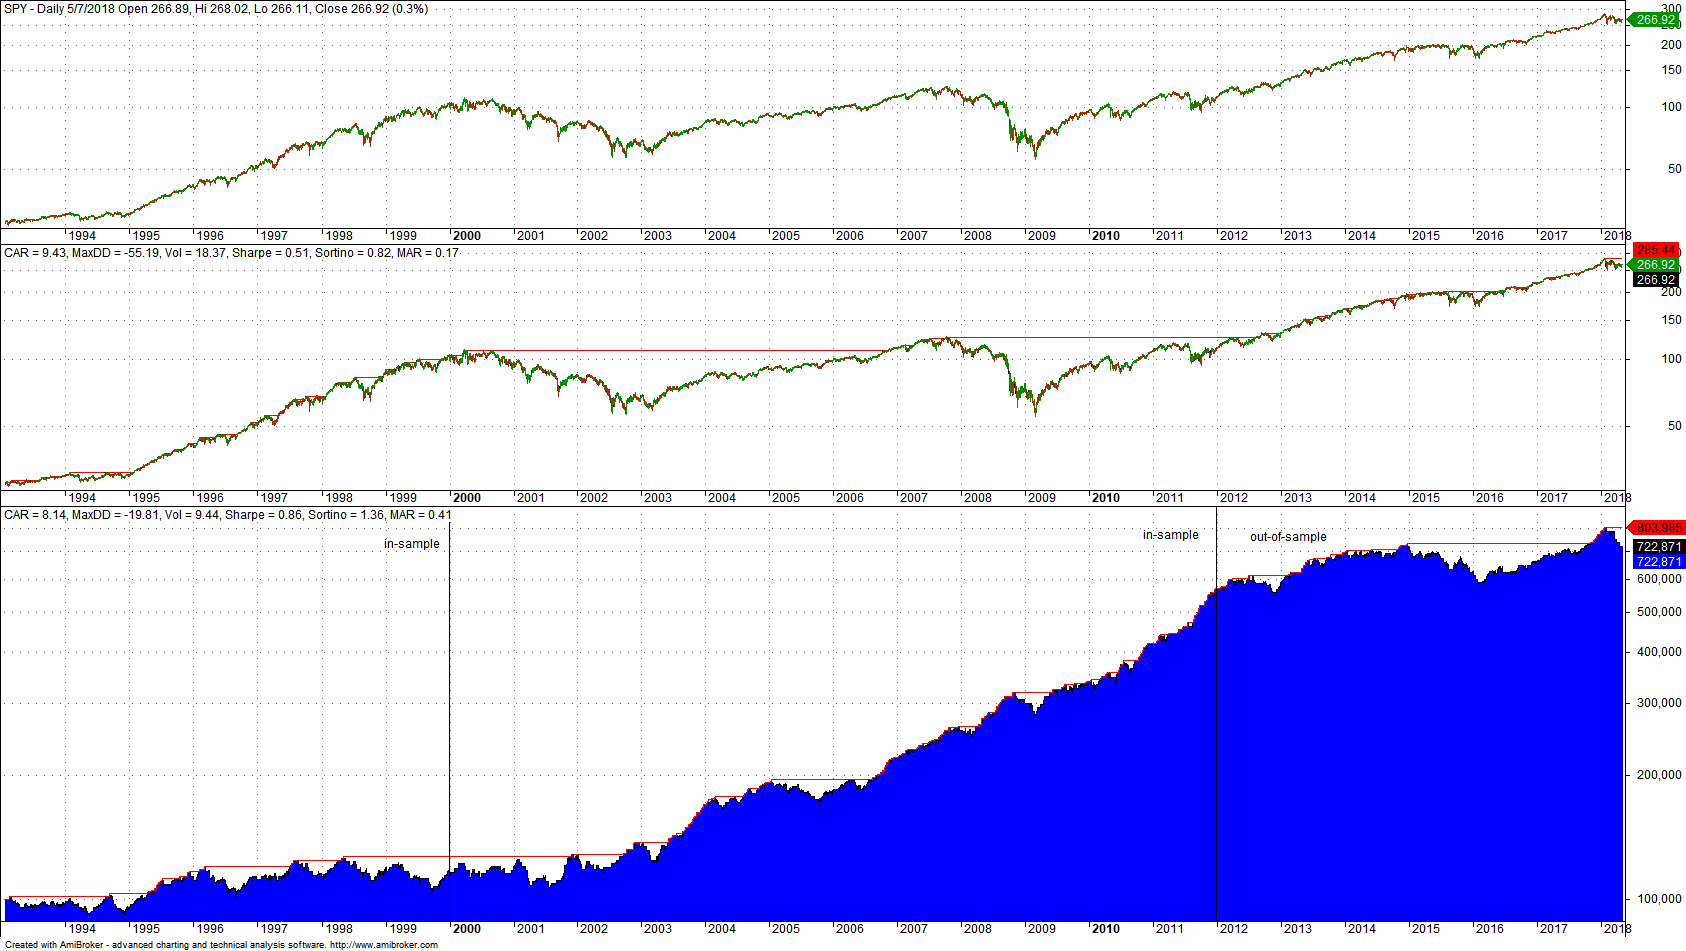
It may be seen that performance is positive in both out-of-sample periods, before and after the in-sample. Specifically, CAGR from 01/29/1993 to 12/31/1999 is 3.02% and from 01/03/2000 to 05/07/2018 CAGR it is 3.08%.
Conclusion
The intention of this article was to show how to use DLPAL S to discover volume strategies The results were based on a particular time period and security and cannot be generalized. DLPAL S provides the capability for developing trading strategies based on parameter-less patterns but all results should be carefully evaluated. Follow our disclaimer link below.
You can order a demo of DLPAL S from this link. For more articles about DLPAL S click here.
Subscribe via RSS or Email, or follow us on Twitter.
Charting and backtesting program: Amibroker


