


Three long/short strategies for trading Dow Jones component stocks in the daily timeframe are developed and analyzed based on features generated by DLPAL LS software. These strategies fulfill the objective of higher risk-adjusted returns as compared to S&P 500 total return from January 2007 to June 2018.
Long/short equity strategies hold both long and short positions simultaneously. If these strategies are designed properly, then they generate higher risk-adjusted returns especially during bear markets. The strategies developed and analyzed in this article are medium to high capacity based on idiosyncratic features, also known as predictors or attributes in machine learning terminology.
The features were generated by DLPAL LS software using data from 01/2000 to 12/2006. One of our objectives of this study was to determine how simple strategies based on these features behaved during the 2008 bear market.
DLPAL LS software calculates values of a number of features using the historical data of each stock in a specified group. The frequency of the data can be daily or weekly. In this article, long/short equity signals were generated by strategies based on the product of two features, Pdelta and S. More details can be found in the program manual and in this article.
The historical data files of the features generated by DLPAL LS can be imported in a backtesting platform for developing and testing long/short strategies. In this article we use Amibroker and 29 data files of Dow stocks (V is not included due to a short history.) Usually, a minimum of six years before the start of the feature history generation is required for robust results. In this case there are 7 years, 2000 – 2006.
Long/short strategies
Time-frame: Daily (adjusted data)
Strategy type: Long/short equity
Universe: 29 Dow stocks from current composition
Backtest period: 01/03/2007 – 06/04/2018
Maximum open positions: 28
Commission per share: $0.005
Position size per stock: Equity/28
Position entry and exit: Open of next bar
Strategy A
Buy = Cover = Pdelta × S > 0
Short = Sell = Pdelta × S < 0
In this strategy there is no restriction on having equal long and short positions. A maximum of 28 positions are held.
Strategy B
Score = Pdelta × S
The 29 stocks are ranked by highest score, as defined above. The strategy goes long or short up to 28 stocks combined depending on the sign of the score.
Strategy C
Score = Pdelta × S

long/short dollar neutral
The 29 stocks are ranked by highest score, as defined above. The strategy goes long the top 14 stocks and short the bottom 14. In this sense the strategy is dollar neutral.
The strategies are simple and based on the features only with no added filters or thresholds determined by analysis.
Performance results
| Parameter | Strat A | Strat B | Strat C | SP500TR |
| CAGR | 5.6% | 5.8% | 3.2% | 8.2% |
| Max. DD | -13.2% | -13.6% | -9.7% | -55.2% |
| Sharpe | 0.73 | 0.75 | 0.60 | 0.41 |
| MAR | 0.42 | 0.43 | 0.35 | 0.15 |
| Trades | 31439 | 33344 | 29756 | – |
| Long trades | 15834 | 17043 | 13473 | – |
| Short trades | 15605 | 16301 | 16283 | – |
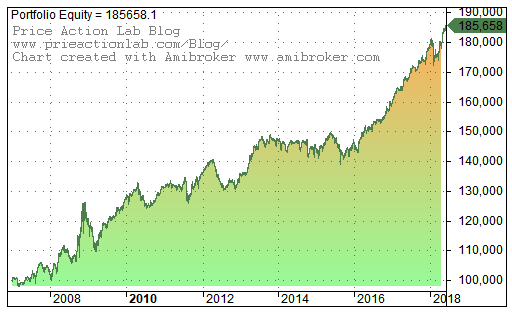
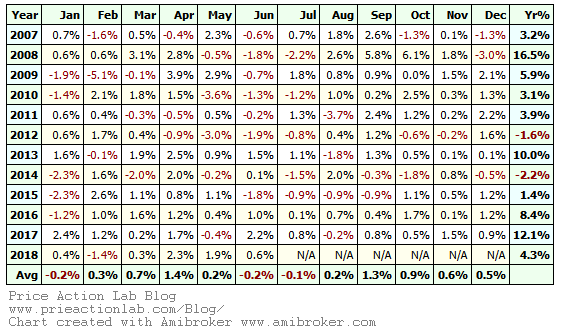
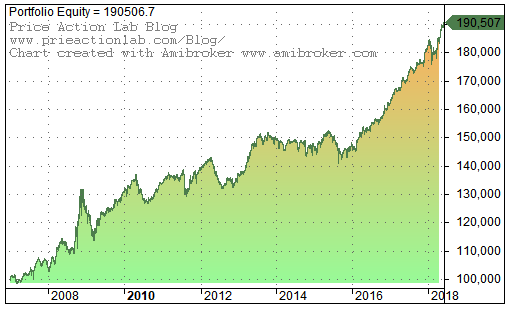
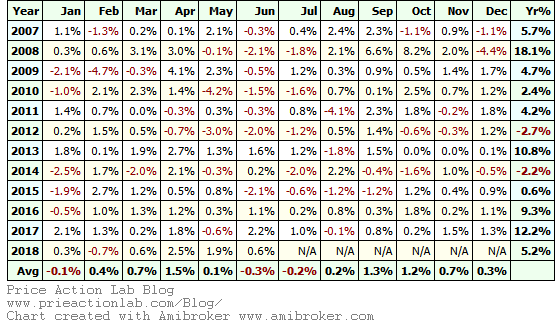
| 2008 return | +16.5% | +18.1% | +10.5% | -34.3% |
Strategy B appears to have the best performance and when compared to Strategy A there are small differences. Strategy C has the lowest performance but also lowest drawdown.
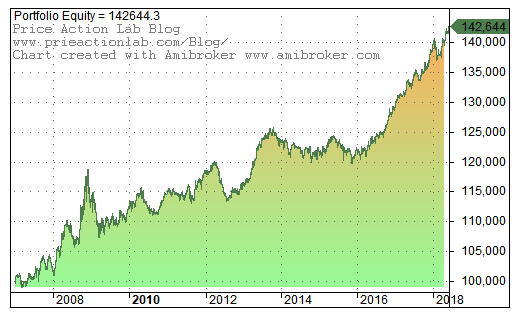
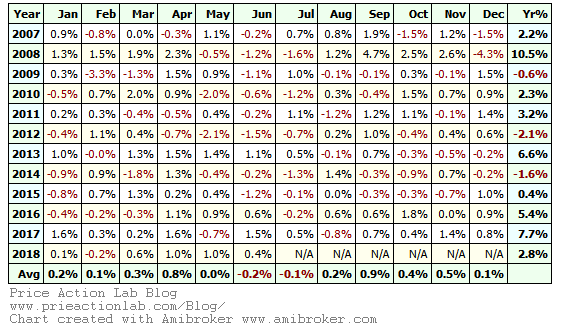
Below are equity curves, underwater equity curves and monthly returns tables.
Strategy A
 |
 |
 |
Strategy B
 |
 |
 |
Strategy C
 |
 |
 |
Monte Carlo Simulations of drawdown performance
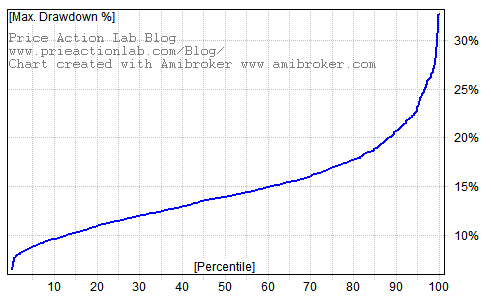 Strat A |
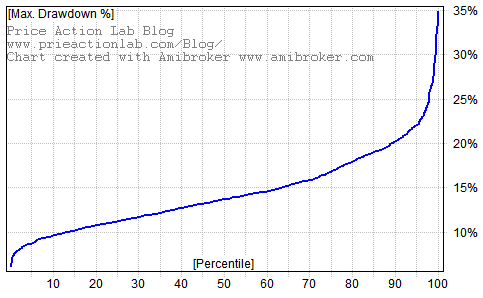 Strat B |
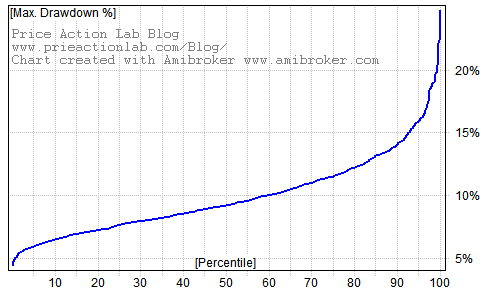 Strat C |
The probability of drawdown greater than 20% for strategies A and B is less than 10% and the probability of a drawdown greater than 14% for strategy C is also less than 10%.
Conclusion
The results in this article indicate that:
(1) There is potential in the features developed by DLPAL LS
(2) Long/short equity strategies can generate high risk-adjusted returns and high absolute returns even in bear markets
More articles about using DLPAL LS can be found here.
Ordering a free one-month fully-functional demo
Established hedge funds with web presence can receive a free fully functional license of DLPAL LS valid for one month by contacting us at: pal@priceactionlab.com
Important: Use an email address based on the hedge fund domain name. This is an example of an acceptable email address: john@bestunicornhedgefund.com. We do not reply to emails from free email accounts (gmail, yahoo, etc.) since we cannot verify their origin Also include the following in your email:
- Fund name
- Hedge fund full address
- Your name and position
- Telephone number
- Website of hedge fund
By sending us an email you consent to collection of submitted data.
Note that free trials are not available to individuals and we reserve the right to deny any requests for a trial version.
If after testing the program you decide it can add value to your business you may contact us for pricing and more details. For a limited time we offer free support to demo users.
If you have any questions or comments, happy to connect on Twitter: @priceactionlab
Strategy performance results are hypothetical. Please read the Disclaimer and Terms and Conditions.
Charts were created with Amibroker


