


In this article we analyze the price action in SPY ETF after the short term bottom on June 28, 2018. A significance test is applied to determine the robustness of the results.
The short-term bottom formed in SPY on June 28, 2018, is shown in the chart below.
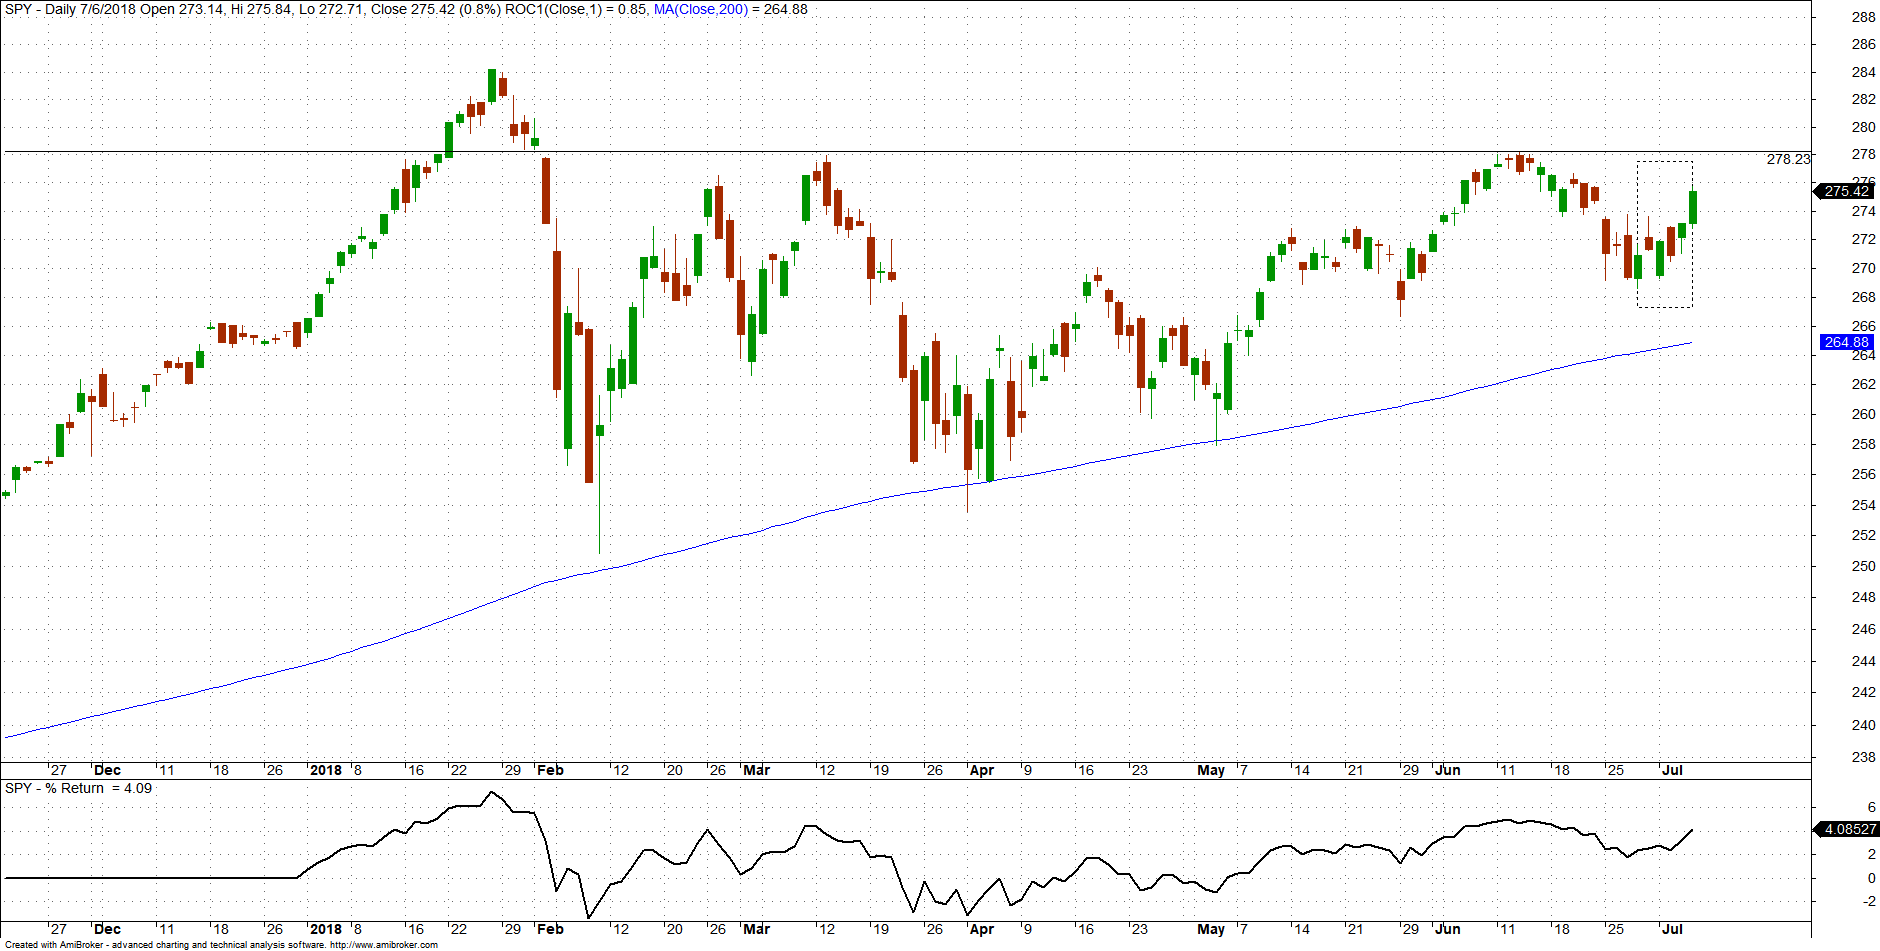
A total of six daily price bars are involved in this short-term reversal pattern and are enclosed in the dotted rectangle.
We will use DLPAL DQ software to analyze this 6-bar formation for possible high profitability patterns. DLPAL DQ identifies parameter-less strategies in historical price data that fulfill user-defined performance statistics and risk/reward parameters as of the last bar in the input data files. These strategies are also known as price patterns.
Below is the workspace for analyzing the price action in the last 6 daily price bars.
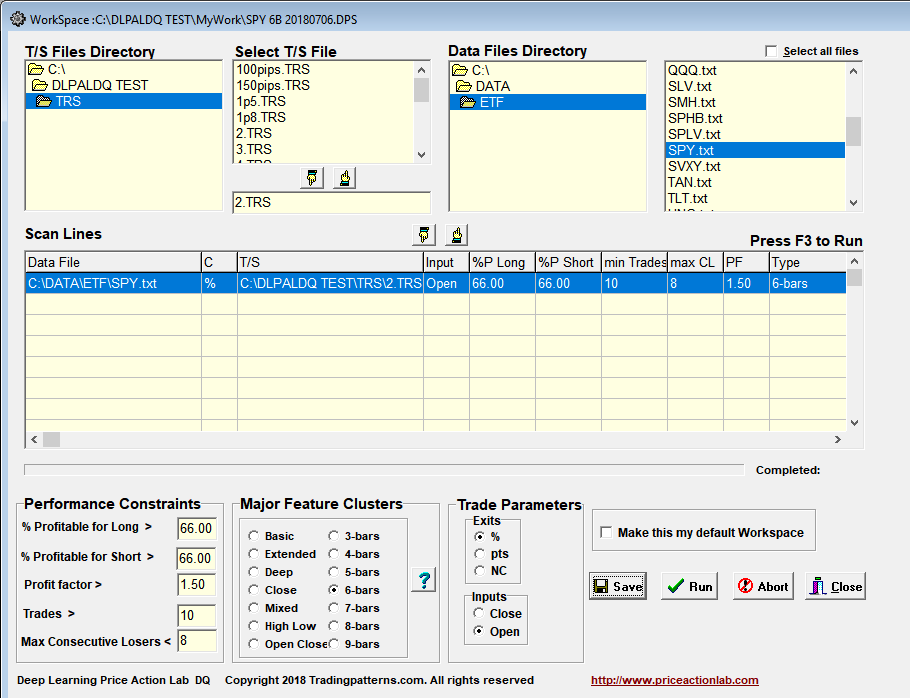
The “6-bars” option was selected from the Major Feature Clusters option. This instructs the program to analyze only the most recent 6 bars in the daily data file selected. The other parameters are set as shown in the screenshot of the workspace above.
After a few seconds the following results are we obtained.
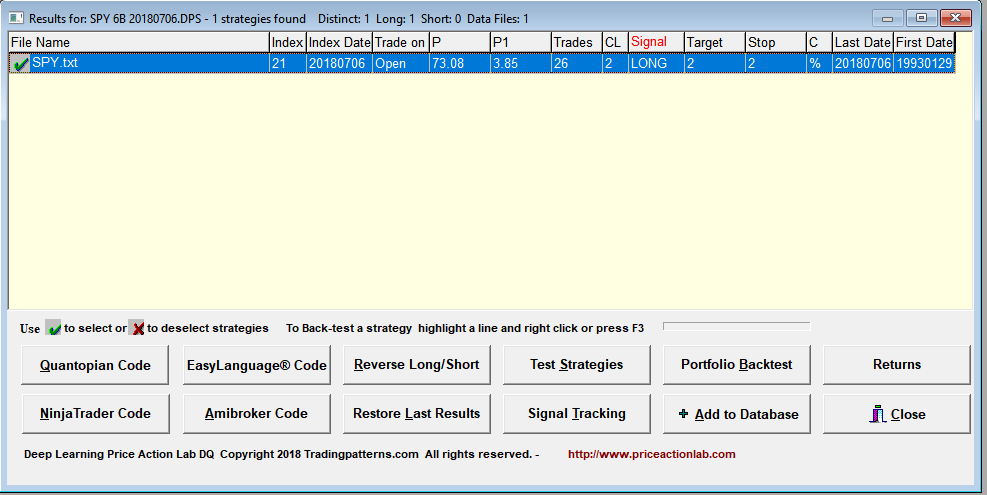
P is the win rate, P1 is the 1-Bar win rate, Trades is the number of historical trades, CL is the maximum number of consecutive losers, Target and Stop are the values of the profit target and stop-loss, C indicates the type of exits, in this case percentages added to entry price shown in Trade On as the open of next bar.
The program found only one strategy (price pattern) that fulfills the specified criteria. This is a long signal with 26 trades in the history of SPY ETF at 73.08% win rate for the specified 2% profit target and stop-loss.
Due to the small data sample, we need to investigate the significance of this signal. DLPAL DQ offers the option of fast and efficient portfolio backtest on a group of securities. In this case we select the Dow group current composition with data since 01/2000 to eliminate the 1990s uptrend bias. Below are the results.
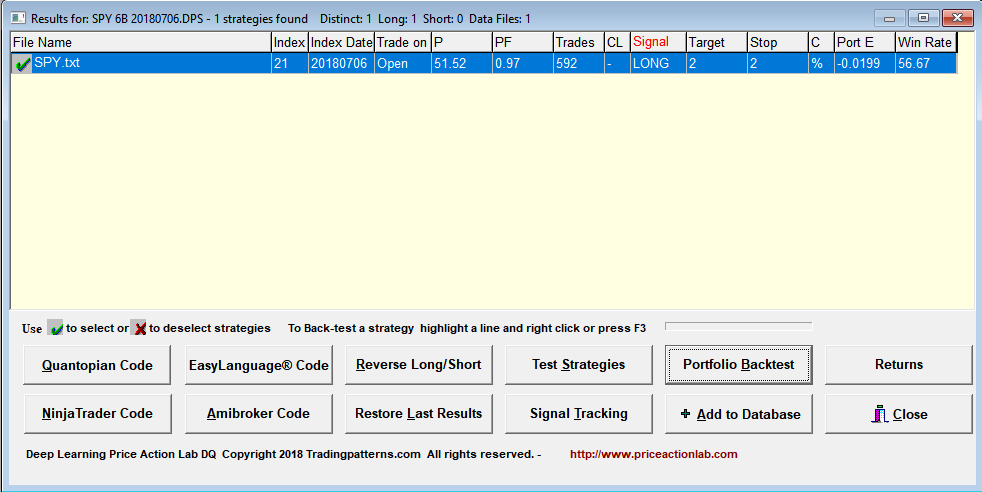
The portfolio backtest increased the sample size from 26 to 592 trades. The portfolio expectation Port E (average trade) is lightly negative and the portfolio profit factor PF is also slightly less than one. These results show that on the group of securities tested, the signal produced random results. This probably means that the signal is random although there is always a chance of a Type-II error (false rejection.)
More articles about using DLPAL DQ to analyze price action can be found in the Quant Trading Articles section.
Click here to order a trial license
For more articles about all DLPAL DQ click here.


