


In this article we look at the effects of dividend adjusted data on portfolio backtests.
This subject is vast and fairly complex. Using dividend-adjusted data offers certain benefits over the use of unadjusted data, such as a more realistic account of returns. Drawbacks in the case of portfolio backtests include signal variations and unrealistic commission costs due to the data adjustments. How large are these effects? There can be no general answer since the overall effect will depend on the number of securities, the size of dividends, the ranking method or algorithm, the timeframe and duration of the backtests.
In this article we consider only two strategies trading Dow 30 stocks. Since we are interested only in dividend adjustment effects we consider only the current composition of the index.
The first strategy is a naive rotation based on 10-month rate-of-change rank. The strategy goes long the stocks with positive rank and short the stocks with negative rank. The timeframe is monthly and position size is equity/30
The second strategy is based on our mean-reversion PSI5 algo and it is in the form used by our premium service to generate weekly signals for Dow 30 stocks. This is a long-only strategy with downside protection that trades up to 20 stocks with position size equal to equity/20.
In all backtests we have applied commission of $0.01 per share.
Naive Rotation
Below are the backtest results for the naive rotation strategy
| Parameter | Unadjusted data | Adjusted data |
| CAGR | 4.3% | 4.9% |
| Max. DD | -17.7% | -17.8% |
| Sharpe | 0.47 | 0.57 |
| MAR | 0.24 | 0.27 |
| Trades | 594 | 582 |
| Win % | 31% | 32% |
It may be seen that CAGR for adjusted data is larger by about 60 basis points. Unadjusted data generate 12 more trades. Win rate is about the same and this holds also for Sharpe, MAR and maximum drawdown. Overall, the unadjusted data backtest lags behind in performance by a small upward drift imposed by dividend adjustments. The average drift is about 0.56% as will be seen below.
Equity curves
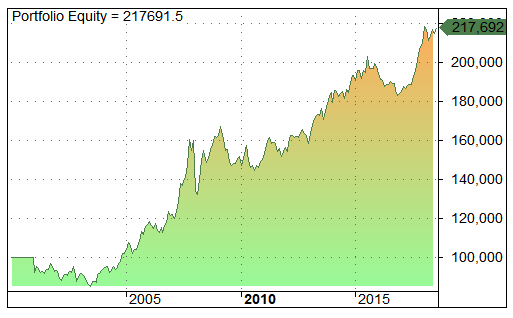 UNADJUSTED |
 ADJUSTED |
Mean-reversion
Below are the backtest results for the mean-reversion strategy
| Parameter | Unadjusted data | Adjusted data |
| CAGR | 6.3% | 7.05% |
| Max. DD | -12.64% | -12.9% |
| Sharpe | 1.00 | 1.11 |
| MAR | 0.50 | 0.55 |
| Trades | 4419 | 4398 |
| Win % | 66.7% | 67.2% |
In this case CAGR for adjusted data is larger by about 75 basis points. Unadjusted data generate 21 more trades. Win rate and maximum drawdown are about the same. Sharpe and MAR are slightly better for the adjusted data case. Overall, the unadjusted data backtest lags behind in performance by the upward drift imposed by dividend adjustments. The average drift is about 0.69% as will be seen below.
Equity curves
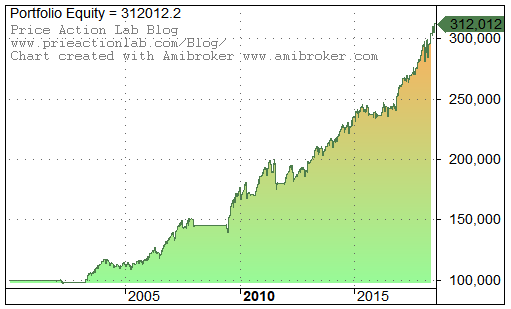 UNADJUSTED |
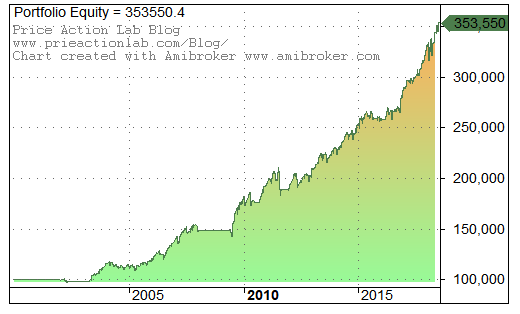 ADJUSTED |
Combined Results
The combined results below show returns by year for both strategies, for unadjusted and adjusted data, return differences by year and averages.
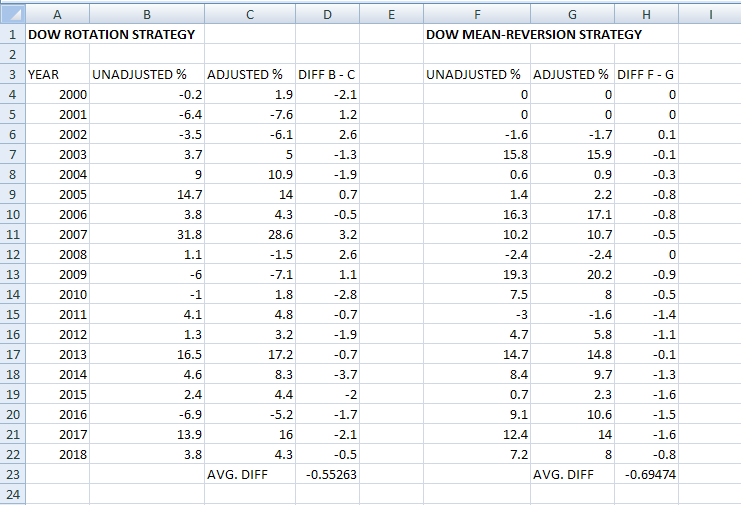
The average difference in each case is close to the difference in CAGR between unadjusted and adjusted data. In both cases it is much less that 1% annualized.
The following observations were made:
- The differences in favor of adjusted data are small and in the case of the mean-reversion strategy 1.6% at most.
- Difference in number of trades is small, less than 0.5%
- Equity trends and drawdown levels are not affected by choice of data
The conclusion is that the choice of unadjusted vs. adjusted data has limited impact on backtest results. Therefore, to maintain consistency with actual trades, unadjusted data for dividends are preferable. Obviously, data must be adjusted for any splits.
This study used only two strategies and results cannot be generalized. There may be cases where choice of data series is dictated by particular strategy use. But we suspect that in the case of portfolio backtests, any variations due to choice of unadjusted vs. adjusted are kept small.
If you found this article interesting, you may follow this blog via any of the methods below.
Subscribe via RSS or Email, or follow us on Twitter
If you have any questions or comments, happy to connect on Twitter: @mikeharrisNY
Charting and backtesting program: Amibroker
Technical and quantitative analysis of Dow-30 stocks and 30 popular ETFs is included in our Weekly Premium Report. Market signals for longer-term traders are offered by our premium Market Signals service.


