

Successful detection of anomalous price action in the daily time frame can offer an edge, especially under the discretion of an experienced trader. In this article we discuss one method of detection and include an example of the results.
Why detection of anomalous price action behavior is important
In markets, any deviations from normality usually provoke actions from market participants. Identifying an anomaly and associated direction of prices may provide a significant edge. Certain price action anomalies cause further deviations from normality until prices revert back and certain others affect an immediate reversion to previous states. Therefore, exploiting anomalies requires establishing timing and direction at the same time and this is obviously a difficult problem.
Problems in trying to identify anomalies
The fundamental problem in the identification process is market noise and possibility of getting fooled by randomness. Note that in finance we can never know what is a sufficient sample with certainty and results may be random due to a lack of it. But more importantly, results are always evaluated in the context of ensemble probability (averages.) In the time domain, which is where traders actually operate, consecutive losses may cause uncle point so it is important to also maximize the win rate. This is an additional severe requirement that makes price action anomaly detection a challenging problem.
Methods for detecting anomalies in price action
There are three basic methods: visual charting, unique hypothesis and data-mining.
Visual charting can be influenced by cognitive biases, such as selection, confirmation, etc.) and has been abandoned by most professionals although retail traders still use it because it is easy to learn and apply. However, the mathematical expectation from visual charting is equal to zero before trading friction effects because the process is basically random.
Unique hypothesis formation is difficult but if one passes the tests successfully it can result in a substantial edge. The major advantage of unique hypothesis testing is that out-of-sample performance is an unbiased estimator of future performance. But how does one know whether a hypothesis is unique and not used by other market participants? This is a serious issue and the answers are not easy to get.
Data-mining is the most popular method used by quants nowadays: genetic algorithms, neural networks, deep learning but also brute force methods are employed for this purpose. The fundamental problem of data-mining for price action anomalies is that out-of-sample testing no longer provides an unbiased estimate of future performance and more advanced validation methods must be used to rule out Type-I error (false positives.) This fact increases the complexity in applying the method and true edge detection is hard.
Price action anomaly detection in the daily timeframe
Our solution for detecting price action anomalies is based on a proprietary deep learning algorithm that exhibits no stochasticity (same results are always generated for identical data samples.) The same method with appropriate modification can be used for systematic strategy identification but also for quantitative discretionary trading. Below we discuss the latter option.
This is a typical workspace of DLPAL DQ, our solution for price action anomaly detection in the form of parameter-less price patterns in the daily timeframe.
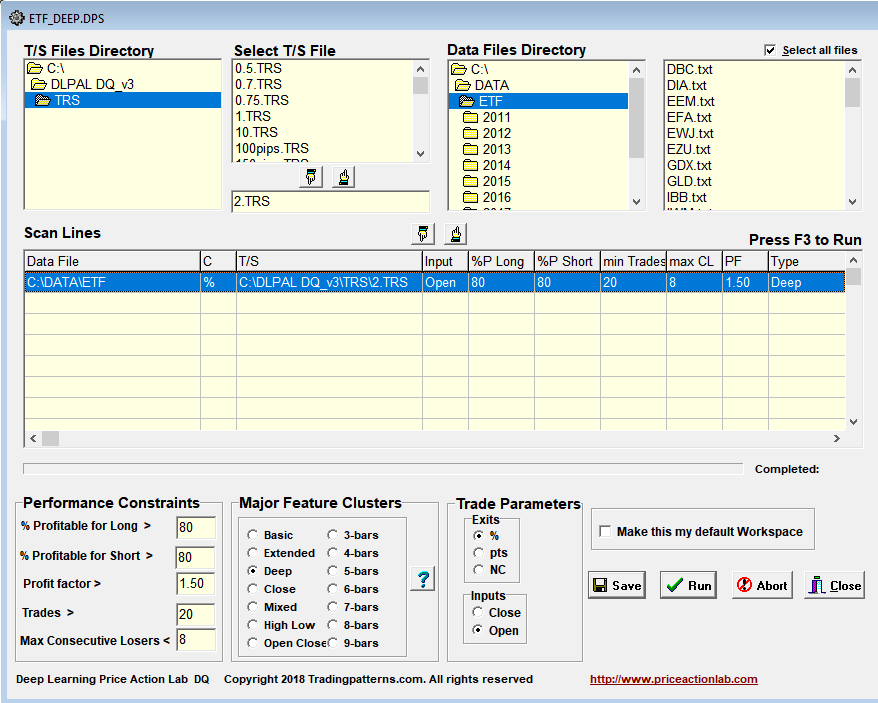
In the above example we are scanning 84 large cap stocks from the S&P 100 universe (those with price history that goes back to 2000) We use data from 01/03/2000 to 01/24/2018 in this particular example and the process of anomaly identification is repeated daily after updating the price series of the stocks.
In a nutshell, the software identifies models based on certain features that fulfill user-defined performance criteria and risk/reward objectives. These models are based on anomalous price action that has a minimum number of occurrences in the price history of each stock. We are looking for models with high win rate, greater than 80%, and sufficiently large profit factor, greater than 1.5, for small profit target and stop-loss, in this example 2%. Since we are looking for short-term price action anomalies, we use a small profit target and stop-loss to avoid fitting performance to random trends in the price series. In effect, we are looking for anomalies that generate a quick profit or loss. We want to stay in the market for the shortest period of time possible to avoid reflexive actions.
Validation of the results can be quantitative or discretionary in the context of recent price action based on chart analysis and other indicators. DLPAL DQ offers capability of portfolio backtests and robustness tests. Portfolio backtests are performed with a click of the mouse on any number of comparable securities, for example Dow 30 stocks, for each anomaly detected in a stock. The problem of portfolio backtests is that they are strict and can result in Type-II errors (false rejections) since the sample size is increased significantly, usually by one or even two orders of magnitude. On the other hand, robustness tests are only useful in rejecting candidate models since over-fitted ones will always have high robustness by definition. Often, naive quants who are unaware of the limitation of validation methods, use robustness tests, including Monte Carlo analysis, for excepting models, while these are only good for rejecting models.
Below is an example of results based on discretionary validation after the close of Monday, September 24, 2018:

The three accepted price action anomalies were one long in COP and two short in SBUX and F. The average return for the next day, Tuesday, September 25, 2018, from the open of the day to the close, is also shown and it is equal to 0.6%. Note that these results were published in our daily Premium Stocks report.
The above implementation in DLPAL DQ is only one way of detecting and evaluating price action anomalies. A major advantage is that the models of the anomalies are simple to understand and can be described with simple math. The disadvantage is that this limits the universe of possible anomalies to non-abstract models. However, there is no consensus in the field if abstract models, such as those generated by SVM ML algos for example, have any advantages over simpler and non-abstract models. One could use SVM classifiers as a second layer with the above method to identify higher probability signals but success of their use in first layer is questionable.
Summary
Price action anomaly detection is a challenging task and there are several choices available to quant traders but they all have certain advantages and disadvantages. In this article we briefly discusses one method for identifying price action anomalies in the daily timeframe and provided an example for large cap stocks. The same method can be used for other markets, ETFs, forex and futures, provided there is sufficient price history available.
If you found this article interesting, I invite you follow this blog via any of the methods below.
Subscribe via RSS or Email, or follow us on Twitter
If you have any questions or comments, happy to connect on Twitter: @mikeharrisNY
Charting and backtesting program: Amibroker
Market signals from systematic strategies are offered in our premium Market Signals service. Stock signals are offered daily in our Premium Stocks report. For all subscription options click here.


