


A bear market may or may not be around the corner but this indicator is not an ominous sign of one. Anyone relying on it is being fooled by randomness and small samples.
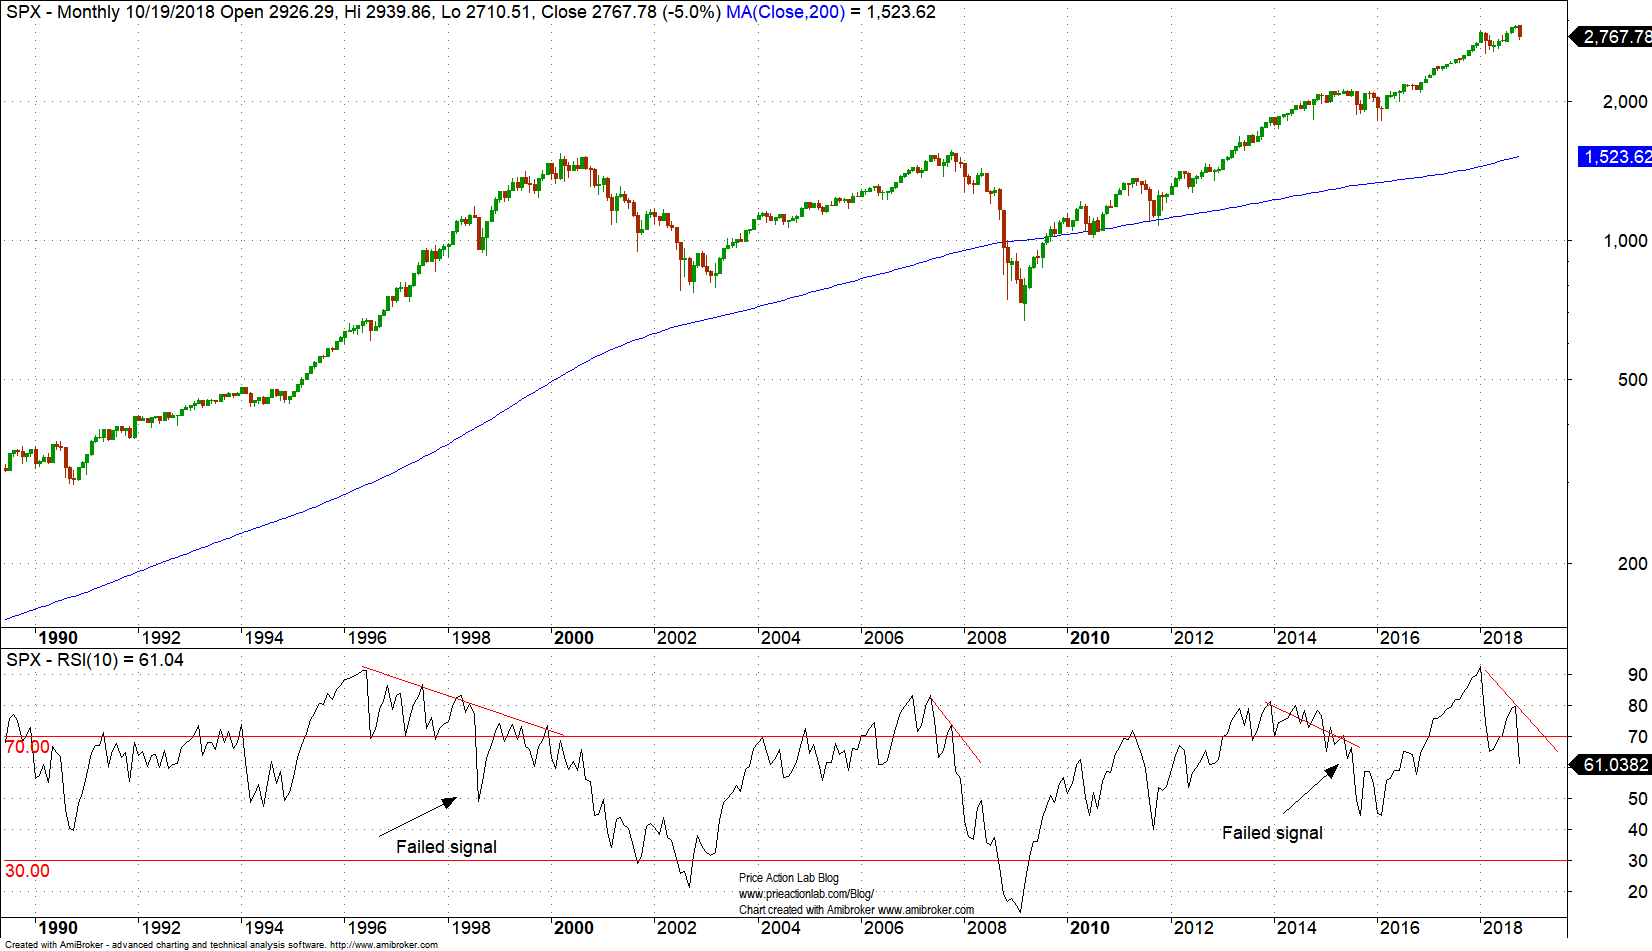
In recent days a chart appeared in social media that shows past divergences on a monthly chart between the RSI(10) indicator and S&P 500 price. The creator of the chart claims that the current divergence is similar to past divergences that preceded bear markets. I have replicated the chart below. Click on image to enlarge.
Most charts of this kind attempt to make a quick impressions to those who do not take the time to scrutinize their claims. If fact, some try to reinforce wishful thinking.
If you take a close look at the above chart, the first divergence between price and the RSI(10) in the monthly timeframe was followed by a gain of the index of about 45% after the Rubble Crisis in 1998. The RSI(10) fell below 50 and then rose again as the market gained momentum. A bear market occurred after that failed signal.
As has been mentioned numerous times in this blog, the RSI is short-term momentum indicator. It takes only a couple of up or even flat periods to reverse the direction of this indicator from oversold to overbought or neutral territory.
In the 90s case bear that relied on this indicator got crushed. Same situation in 2015-2016 with another failed signal and no bear market. The only valid signal is for the 2008 bear market.
Therefore, this is actually a signal with a sample of one. There is nothing wrong with samples of one except that we cannot assess the significance of any claims made. In other words, the outcome could be a coin toss. In my opinion it is. There is no significance in monthly indicators because they are not necessary for price action. They just happen by virtue of being derivatives of price while suffering from lag effects.
Conclusion: If you are a bear and you are looking for a chart to reinforce your bias maybe this is a good one after avoiding to scrutinize claims made. If you are a serious analyst or investor who relies on evidence then you have to look deeper to assess the risks of a bear market at this point.
If you found this article interesting, I invite you follow this blog via any of the methods below.
Subscribe via RSS or Email, or follow us on Twitter
If you have any questions or comments, happy to connect on Twitter: @mikeharrisNY
Market signals from systematic strategies are offered in our premium Market Signals service. Quantitative stock signals are offered daily in our Premium Stocks report. For all subscription options click here.


