


Last time Dow Jones Industrial Average was up nine straight weeks was in May 1995 as the dot com “irrational exuberance” was brewing. Below are some statistics and my comments.
Below is a chart of DJIA since 1915 with my Win Streak (WS) indicator. When WS(9) is at 100 in weekly chart, then this means the index is up nine straight weeks and when it is at 0, then it is down nine straight weeks.
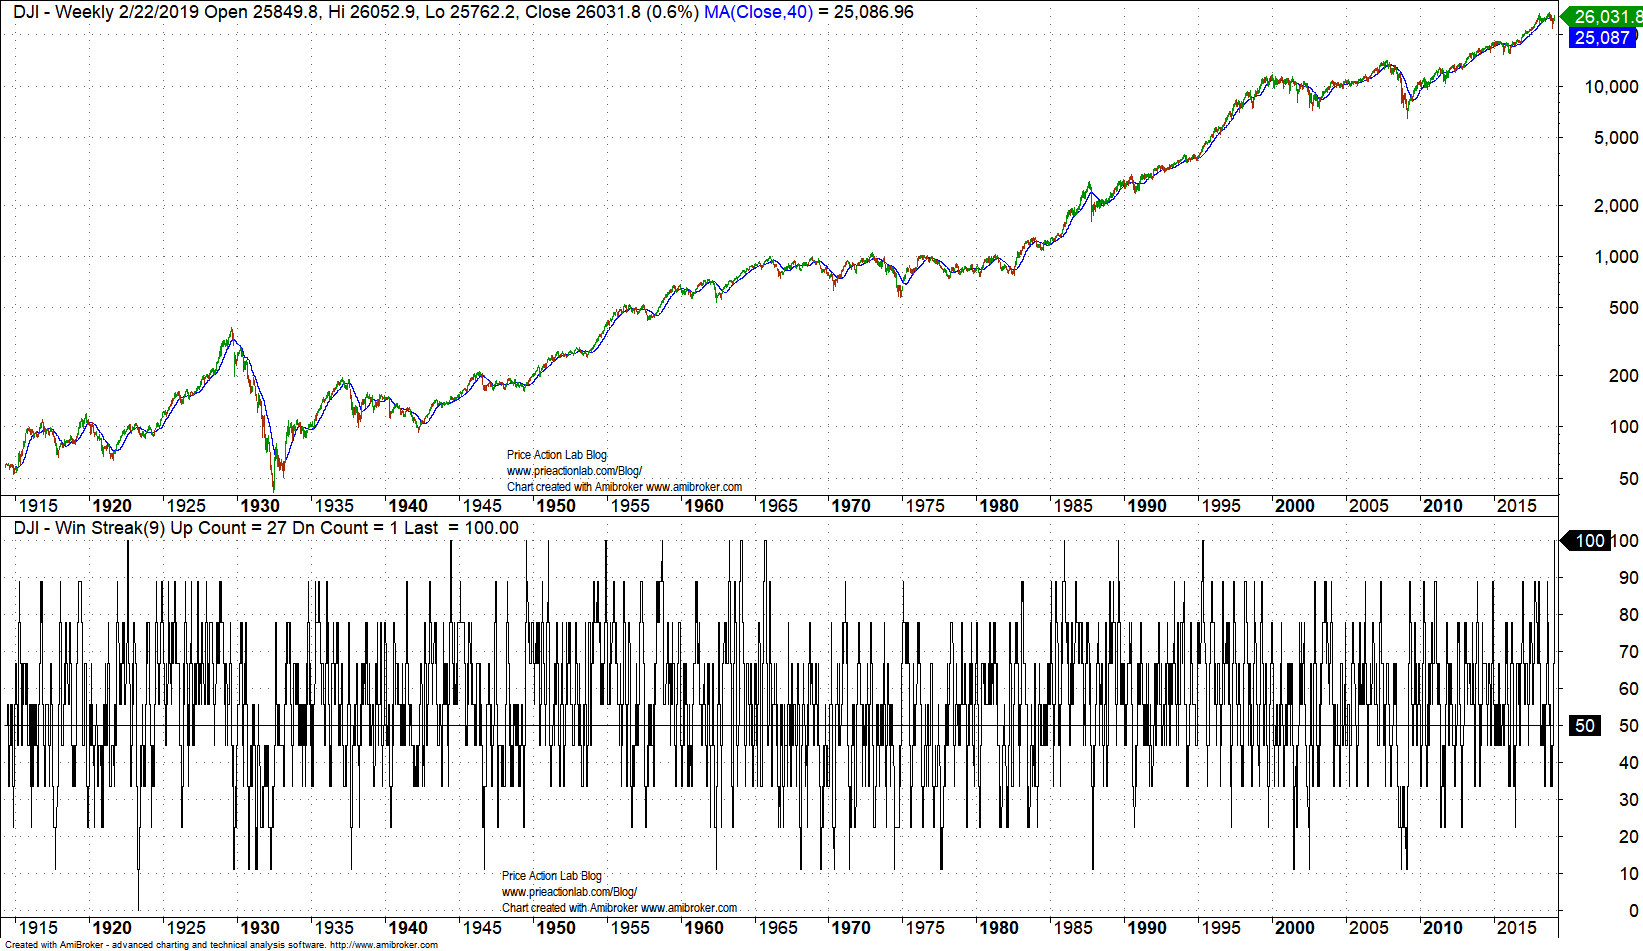
There have been 27 (not necessarily non-overlapping) instances of DJIA up nine straight weeks and only one instance of down nine straight weeks.
More interesting in my opinion is the following: a nine week winning streak has only occurred near a market top only once in October 1965: a 25% correction/bear market started January 1966 and ended in October of the same year.
Therefore, 26 out of the 27 times the index was up nine straight weeks this event has occurred in an uptrend denoting strong momentum. Only once this event has preceded a top and with a three month delay.
Therefore, I will add this one also in my list of useless indicators that are mainly random artifacts of the longer-term upward drift of the market. This and related indicators, for example the longer-term Relative Strength Index, indicate strong momentum and their use as “oversold” indicators is done in the context of the “gambler’s fallacy, also know as the “Monte Carlo fallacy”
Note that I do not want to completely dismiss the fallacy as based on specific tests I have performed under actual conditions and with real funds it may provide an edge but in same specific context. Context is King.
So, given current price action context, is the DJIA up nine straight weeks event good or bad?
I think the answer is that under the same context in many parallel universes the event is bullish and in a smaller number of parallel universes it is bearish but unfortunately the choice for our specific universe may be random. It is not that the indicator is good or bad; we simply do not know what it means due to incomplete knowledge of reality of non-linear, multi-variable, stochastic reflexive processes.
If you found this article interesting, I invite you follow this blog via any of these methods below:
RSS or Email, or follow us on Twitter
If you have any questions or comments, happy to connect on Twitter: @mikeharrisNY
Market signals from systematic strategies are offered in our premium Market Signals service. For all subscription options click here.


