


These equity long/short strategies with Dow 30 stocks deliver high performance at low risk but are suitable only for professional traders and funds with sufficient capital and lower execution cost.
We consider two long/short strategies with rebalancing in the daily timeframe. The strategies are based on features developed by DLPAL LS software. These features result from identification of price action anomalies in daily stock data. The strategies use two of the generated features, Pdelta and S, which correspond to directional bias and its statistical significance, respectively.
Performance results
A performance parameter table is included after the equity curves. Backtest period is from 01/02/2008 to 04/05/2019.
Strategy based on fixed rules
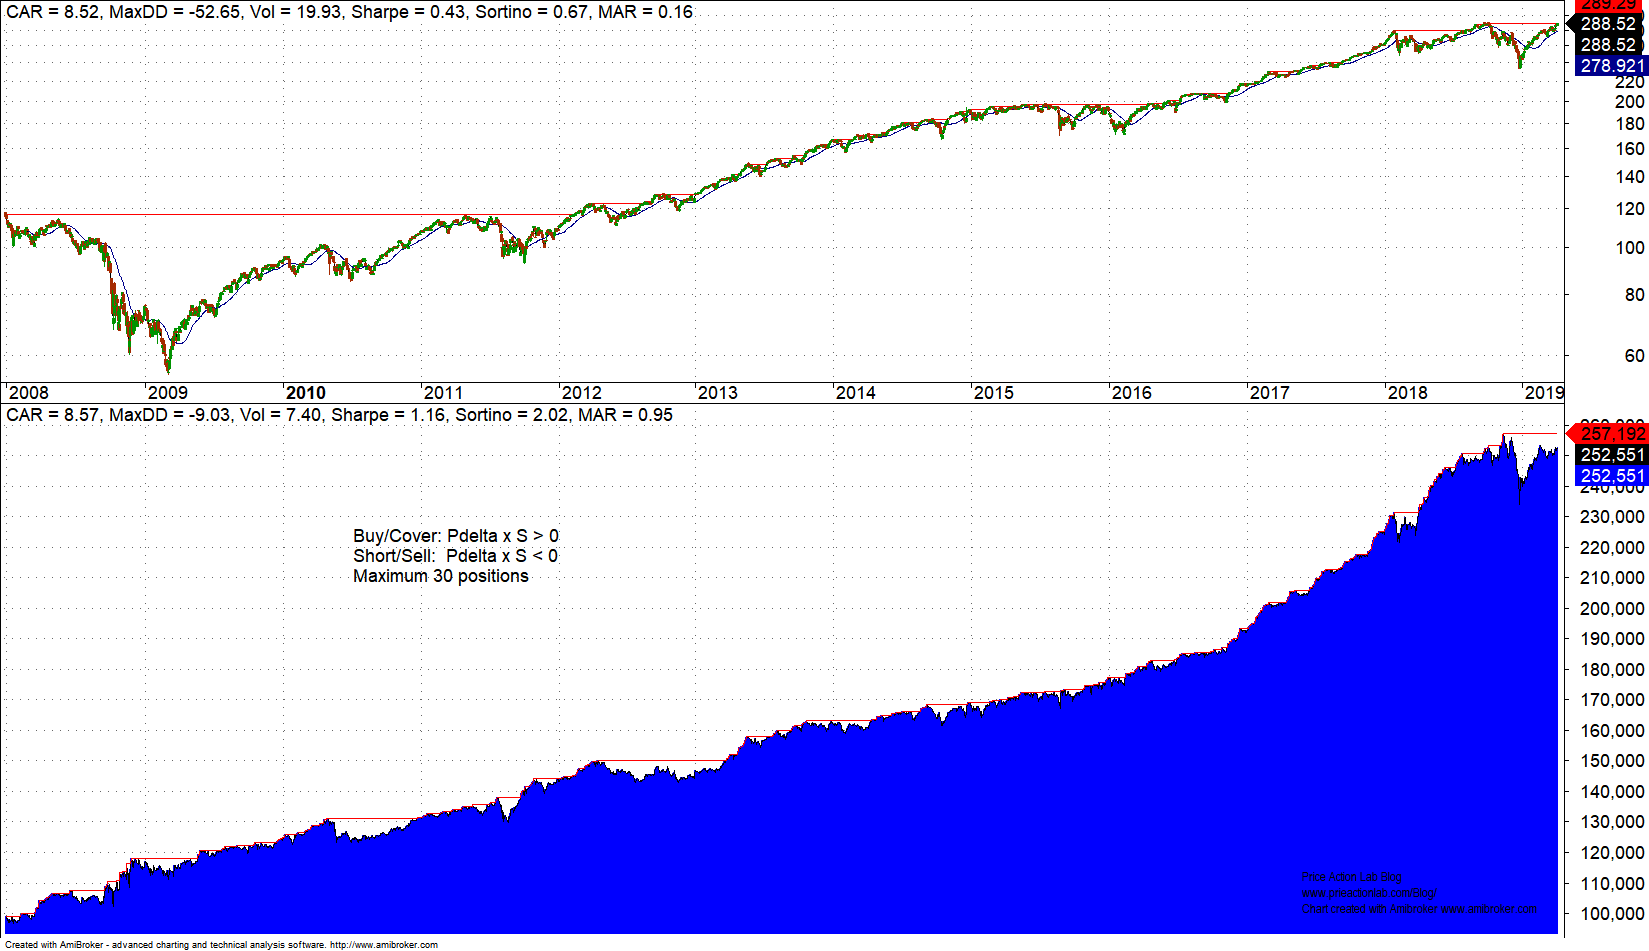
The strategy is as follows:
Buy/Cover if Pdelta × S > 0
Short/Sell if Pdelta × S < 0
Rotational strategy
![]()
The strategy is as follows:
Score/rank: Pdelta × S
Buy/cover up to 15 top stocks with score/rank > 0
Short/sell up to 15 bottom stocks with score/rank < 0
Performance details
| Parameter | Rotational | Fixed rules | B&H (SPY TR) |
| CAGR | 6.5% | 8.6% | 8.5% |
| Max. DD | -4.8% | -9% | -52.4% |
| Sharpe | 1.34 | 1.16 | 0.45 |
| MAR | 1.35 | 0.95 | 0.16 |
| All Trades | 28575 | 32155 | – |
| Long trades | 12537 | 16084 | – |
| Short Trades | 16038 | 16071 | – |
| Win rate | 51.8% | 52.1% | – |
No commissions are included in the results. These types of strategies are suitable only for those with direct access to a prime broker that offers low cost execution and liquidity search algos that minimize slippage. These are not strategies for retail traders because they try to exploit small idiosyncratic edges. For all practical purposes adding friction effects will not affect maximum drawdown much but will impact CAGR by about 200 basis points on the average. The objective here is to discuss the concept and not to provide final strategy details. There are a number of significant steps to convert the idea to an automated strategy that often involve hundreds or even thousands of lines of code depending on specifications.
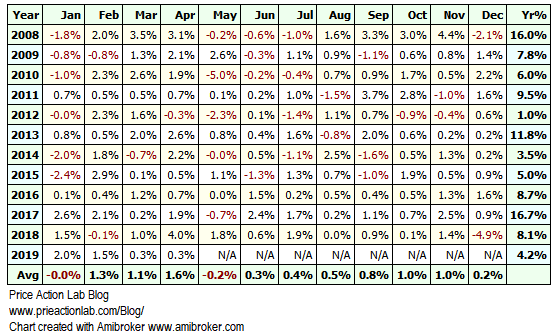
Monthly returns table for strategy based on fixed rules.
Monthly returns table for rotational strategy.
![]()
Comments
- The rotational strategy has less maximum drawdown because it is more “dollar neutral” than the directional strategy based on fixed rules.
- The strategy based on fixed rules shows no losing year.
- Risk-adjusted returns (MAR) are high.
- The edge is small but significant.
- Actual performance will depend on friction (commission, slippages, etc.)
Strategy details summary
Time-frame: Daily (adjusted data)
Strategy type: Long/short equity
Universe: 30 Dow stocks from current composition
Backtest period: 01/02/2008 – 04/05/2019
Position entry and exit: Open of next bar (see comments above about friction affects.)
Example of feature generation
The historical features files were generated by DLPAL LS software. The software takes the original historical data files of the stocks and creates a new set of files with extension .pih that include the feature values for each instance (row). An example is shown below for MSFT.
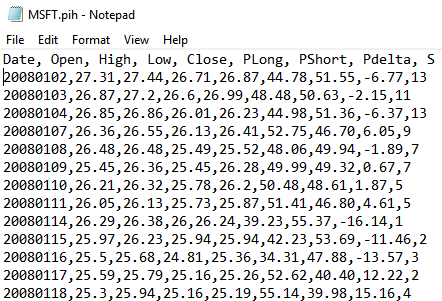
The software updates the files daily as new data come in to facilitate automatic execution.
Edit 04/26/2019: Trade Minimum Holding Period Impact on Equity Long/short Strategy
More details about DLPAL LS can be found here. For more articles about DLPAL LS click here.
If you have any questions or comments, happy to connect on Twitter: @priceactionlab
Strategy performance results are hypothetical. Please read the Disclaimer and Terms and Conditions.


