


Charts reflect past price action that was driven by fundamentals and expectations. These two fundamental drivers of price can change anytime and as a result prices may suddenly reverse course. Those who think that charts can be bullish or bearish and base their trading decisions on such naive assessments sooner or later face the reality of ruin.
Statements of the form “the chart of XYZ is bullish (or bearish) because of this one indicator or that one indicator or that trendline over there or that nice pattern forming” show a remarkable – but also naive – attempt by the part of those who make them to turn post hoc analysis into forecasting. In most cases, the decision as to whether the chart is bullish or bearish is not even related to the state of indicators or any chart patterns but to the cognitive bias of the analyst.
I will show two examples of failed chart patterns to illustrate this notorious behavior by scores of analysts that operate in the blogosphere who try to impose their cognitive biases on the public by assuming some type of authority in a subject they hardly comprehend. The first example is a recent failure of a head and shoulders bottom in AAPL as shown below:
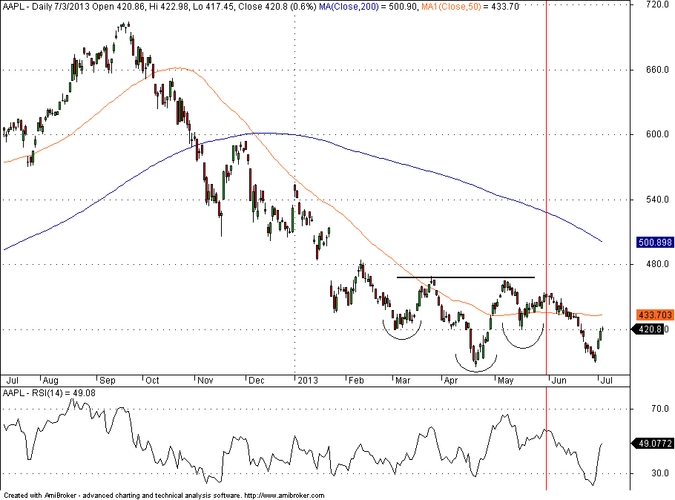
It may be seen from the above AAPL chart that the head and shoulders bottom was not confirmed according to classical chart analysis because price did not break above the neckline but reversed course. This occurred although indicators like the RSI(14) were pointing to a buildup in momentum as shown by the vertical red mark. Thus, although the chart was appearing as “bullish” to some analysts, it was in the best case “neutral”. Many were surprised that an almost symmetric head and shoulders bottom was violated so suddenly. One of the problems with those that were surprised is that they try to enforce their bias about future price direction on the chart and the patterns and indicators are just the vehicle they use to justify this naive act.
Below is the notorious failure of a complex head and shoulders top in bonds (TLT) in 2012. During that time it was very hard to find an analyst who thought that bond prices will go higher:
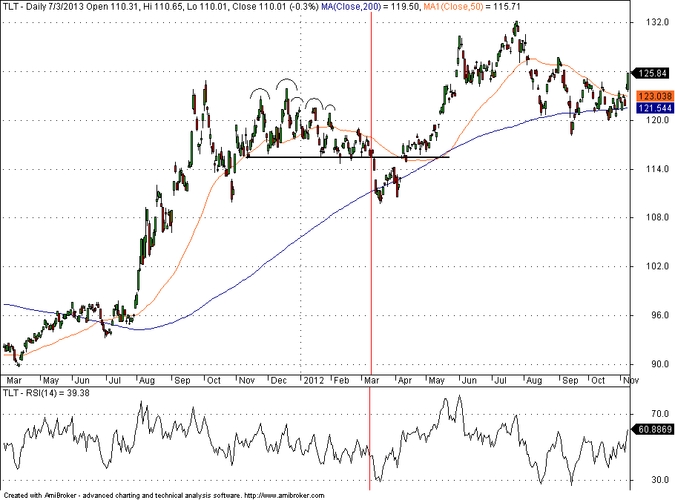
It may be seen from the TLT chart above that the result was a massacre of bears with prices reaching new highs after a false break to the downside and a subsequent royal violation of the complex top. However, even after this major failure of post hoc analysis and a clear example that chart analysis alone not only does not carry any forecasting power but it is only a useful risk management tool, some of the same people who were calling at that time a major, multi-year, final top in bonds and failed continue to use the exact same rationale today for forecasting markets by labeling charts “bullish” or bearish” because of some indicators or chart patterns that may or may not be random but they do not know the answer to that. I hope those who follow such analysis get to understand its dangers before they are ruined.
Disclosure: no relevant positions
Charting program: Amibroker
Disclaimer


