


A GBPUSD position trading system was machined designed by Price Action Lab on June 5, 2012 and the results were published in this blog the following day. In this post it is shown that the system has returned 14% year-to-date so far, based on $20,000 of initial trading capital per standard lot.
Below is the original machine design output for the system, generated on June 5, 2010:

Each line in the results corresponds to a price pattern that satisfies the performance parameters specified by the user. Index and Index Date are used internally to classify patterns. Trade on is the entry point, in this case the Open of next bar. P is the success rate of the pattern, PF is the profit factor, Trades is the number of historical trades, CL is the maximum number of consecutive losers, Type is LONG for long patterns and SHORT for short patterns , Target is the profit target, Stop is the stop-loss and C indicates the type of the exit, in this case it is “pts”. Last Date and First Date are the last and first date in the historical data file.
It may be seen from the results that Price Action Lab found 17 patterns, 11 long and 6 short, which satisfied the performance criteria specified on the workspace the in-sample.
Amibroker code was generated by price Action Lab and a system was tested in the popular platform. below are the trade-by-trade results (one pip commission and slippage is included):
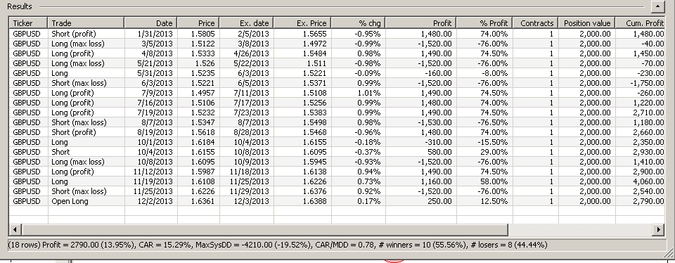
The net return for $20,000 initial trading capital per standard lot is 13.95%. The win rate is 55.56%. A total of 18 trades were placed from 01/02/2013 to 12/03/2013. The profit factor is 1.29, the payoff ratio is 1.03 and the Sharpe ratio is 1. The maximum drawdown was -19%.
Below is a chart of GBPUSD for the test period with the trade signals:

The pink circles on the chart indicate long trades entered at short-term bottoms.
Note that the way the system was tested is very rudimentary and involves combining patterns with a Boolean “OR” and no fancy risk and money management. More advanced ways of implementing systems involve confirmation of signals using multiple patterns and adjusting the position risk – in this case the number of contracts – to take advantage of higher probability setups.
Also, this machine designed system with the specific parameters was just an example of this particular method of developing trading systems. For example, 100 pips for the target and stop-loss seem to be a better choice for a more robust system. To this end, some trial-and-error is required but at the same time emphasis should be placed on reducing data-mining bias.
Finally, the forex market can be a very lucrative one provided one can find a way to develop systems that can beat this zero-sum game. This is very difficult in reality as it is shown in this post. In the longer-term, the wealth-out effect due to commissions paid and slippage can deteriorate performance severely. One can show that although the probability of ruin is very high in the forex market, the return required for rejecting the null hypothesis that a system is random is very high. This means that there are many outliers due to luck alone. These outliers render any significance analysis dubious and it is very difficult to assess that results of systems in their presence. Of course I am talking about forward results because in the case of in-sample results, excellent performance is usually due to curve-fitting.
Disclosure: no relevant positions.
Charting program: Amibroker
Disclaimer


