


Although some quants prefer long/short symmetric trading systems there is no conclusive evidence that they offer any advantages, especially when dealing with markets with a structural bias. In this blog post I present two examples of the performance of trading systems that were machine designed last year.
There are at least two kinds of long/short symmetry: (A) natural, or by design and (B) forced. A 50-200 long/short moving average system is of the former kind because, by design, long trades exit short and short trades exit long. This blog deals with the latter kind, i.e. systems where logic is added to force symmetry. This may be achieved in several ways but the simplest is by removing any exit targets or other exit signals and then letting long signals exit short and short exit long. Protective stops may be kept to limit risk.
SPY trading system
This system was machined designed by Price Action Lab after the close of the last trading day of 2013 with unadjusted SPY data from inception. Below is the workspace used (results are fully reproducible as no randomness was involved):
Amibroker AFL code for all patterns discovered by Price Action Lab with the above workspace settings was used to backtest the resulting system (no selection bias was involved) on SPY data from 01/02/2014 to 11/07/2014. Below are the results for 2.5% profit target and stop-loss. Commission of one cent per share traded was used in all backtests and the starting capital was $100K. Equity was fully invested.
The YTD return is 10.88% on a total of 26 trades, 19 long and 7 short (more details in the table below).
Next, the machined designed SPY trading system is forced to obey long/short symmetry by removing the stops. The resulting equity performance is shown below:
The YTD return is this case is 14.35%, much higher than in the previous case, on a total of 15 trades, 8 long and 7 short (the last trade is an open long – more details in the table below).
It may be seen that both systems have profited from the recent V-bottom but the long/short symmetric one has achieved that with just one long trade.
Performance comparison of SPY trading systems
| Parameter | Target/stop | Symmetry |
| Net return | 10.88% | 14.35% |
| Win rate | 61.54% | 66.67% |
| Trades | 26 | 15 |
| Long trades | 19 | 8 |
| Short trades | 7 | 7 |
| Profit. long | 12 | 6 |
| Profit. short | 4 | 4 |
| Profit factor | 1.59 | 3.85 |
| Payoff ratio | 0.99 | 1.92 |
| Sharpe ratio | 1.20 | 2.13 |
| Max. DD | -5.54% | -5.67 |
The system with forced long/short symmetry is superior to the original system with the profit target and stop-loss, resulting in a much higher Sharpe ratio and a net return exceeding the 10% buy and hold (no dividend reinvestment) by 4.35%. The original system also exceeded the buy and hold return by just 0.88%.
DIA trading system
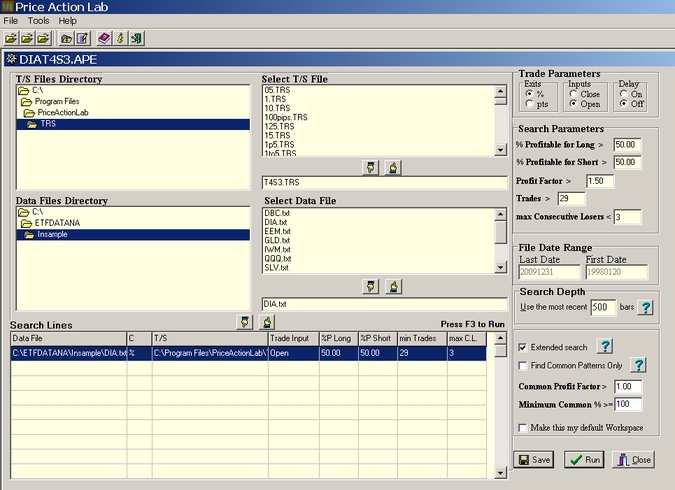
But we should not hurry to draw any conclusions from just one test. Next, we consider a higher reward/risk system for DIA that was machined designed by Price Action Lab on April 21, 2013, as reported in the blog, using an in-sample from inception (01/28/1998) to 12/31/2009. The out-of-sample cross-validation test was done in the period from 01/04/2010 to 03/28/2013. Below is the workspace used (results are fully reproducible):
Amibroker AFL code for all patterns discovered by Price Action Lab with the above workspace settings was used to backtest the resulting system (no selection bias was involved) on DIA data from 01/02/2014 to 11/07/2014. Below are the results for 4% profit target and 3% stop-loss. Commission of one cent per share traded was used in all backtests and the starting capital was $100K. Equity was fully invested.
The YTD return is 17.81% on a total of 9 trades, 6 long and 3 short (more details in the table below).
Next, the DIA trading system above is forced to obey long/short symmetry by removing the stops. The resulting equity performance is shown below:
The YTD return is this case is 9.06%, a lot lower than in the previous case, on a total of 7 trades, 4 long and 3 short (the last trade is an open long – more details in the table below).
It may be seen that the performance of the long/short symmetric system was adversely affected by the recent V-bottom in prices because a long signal arrived late after all the gains from a previous short were erased and in addition the short trade was exited with a loss.
Performance comparison of DIA trading systems
| Parameter | Target/stop | Symmetry |
| Net return | 17.81% | 9.06% |
| Win rate | 71.78% | 71.43% |
| Trades | 9 | 7 |
| Long trades | 6 | 4 |
| Short trades | 3 | 3 |
| Profit. long | 5 | 4 |
| Profit. short | 2 | 1 |
| Profit factor | 10.43 | 3.54 |
| Payoff ratio | 2.98 | 5.70 |
| Sharpe ratio | 3.41 | 1.45 |
| Max. DD | -4.40% | -6.99% |
The system with forced long/short symmetry has a degraded Sharpe ratio although the payoff ratio is higher as expected. Note that both systems exceeded the unadjusted for dividends buy and hold return of 6.10% for DIA, YTD.
Therefore, and as expected, long/short symmetry is a tricky concept. In some cases performance increases substantially but in other cases there is degradation. It is hard to identify the main factors that contribute to better or worse performance that will allow choosing a biased over a long/short symmetric trading system. Possibly, using both types to get average performance may be a better approach and the one I recommend.
You can subscribe here to notifications of new posts by email.
Disclosure: no relevant positions.
Charting program: Amibroker
Disclaimer


