

Price Action Lab can identify patterns in price series that have the potential of being true anomalies. In this article, I outline the steps followed for the identification of potential anomalies in daily data. Validation methods involve increasing the sample size and measuring the robustness of the edge.
The scan function of Price Action Lab can identify potential anomalies in daily data. If the anomalies have a robust edge they can be used in discretionary trading. The steps that are usually followed and briefly discussed below:
Step 1: Update (or generate) daily data for the traded universe
In this example the traded universe consists of the following 30 liquid ETFs
SPY QQQ DIA GLD SLV TLT USO DBC IWM XLF EEM XLE EFA EWJ XLP XLV XRT XLU XLK XLB XLI UNG IBB IYR SMH TAN GDX XHB XME MDY
The daily data since inception of each ETF are updated and properly adjusted. There are several data sources that can be used to accomplish this task. Price Action Lab also offers a tool for checking the integrity of the data.
Step 2: Create (or open) a scan workspace in Price Action Lab:
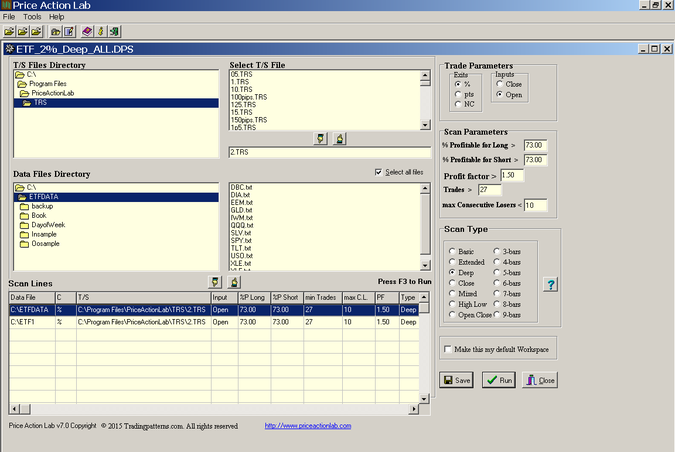
In the above workspace there are two scan lines, the first for 10 ETFs and the second for 20, due to the way the data are updated and stored. However, one search line would suffice if all data files are saved in the same directory.
The win rate for each price pattern identified in all data files is set to 73% for both long and short signals. The minimum number of trades for each pattern is set to 27 and the minimum profit factor to 1.50. The Deep scan option is selected for maximum power.
Note that all patterns have profit target and stop-loss set to 2% to minimize curve-fitting and to allow identifying a potential short-term edge.
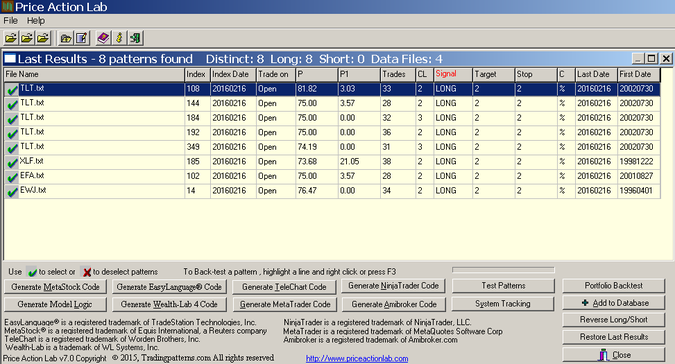
3. Scan results
Results are hypothetical and are NOT an indicator of future results. Please read the full disclaimer at the end of this article.
In the scan results above each line corresponds to an exact pattern. P is the pattern win rate, P1 is the 1-Bar win rate, Trades is the number of trades, CL is the maximum number of consecutive losers and Target and Stop the values of the profit target and stop-loss. C indicates the type of target and stop-loss.
As of the close of Tuesday, February 16, 2016, Price Action Lab identified eight distinct patterns in four ETF, five for TLT and one for each of XLF, EFA and EWJ, that fulfilled the performance criteria specified on the scan workspace.
However, some or even all of the identified patterns may be random and have only survived due to data-mining bias. It is necessary to attempt to validate any potential edge they may offer. We will use portfolio backtests and robustness tests.
4. Validation Using Portfolio Backtests
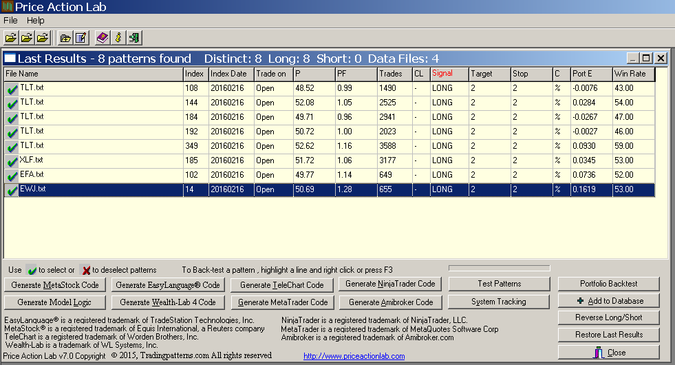
The sample size of the patterns may be significantly increased by backtesting them on a large group of comparable securities. For this particular test we used the S&P 100 group with adjusted daily data since 01/2000. Below are the results:
Results are hypothetical and are NOT an indicator of future results. Please read the full disclaimer at the end of this article.
In the scan results above, each line corresponds to an exact pattern. P is the pattern win rate, Trades is the number of trades and Target and Stop the values of the profit target and stop-loss. C indicates the type of target and stop-loss (%, points, or next close exit). In the case of portfolio backtests, PF is the portfolio profit factor, PortE is the portfolio expectation and Win Rate is the proportion of securities with positive expectation.
It may be seen that the trade sample size of each pattern increased significantly with the portfolio backtest. At the same time, this test allows us to identify potential edges. For example, the last pattern in the list (highlighted) for EWJ has a large profit factor PF when backtested on the 100 stocks while sample size increases from 34 to 655 trades. In addition this pattern was profitable in 53 of the 100 securities (Win Rate of 53.00.) The EWJ pattern is the only one from the original list that has sufficiently large ( > 1.20) portfolio profit factor.
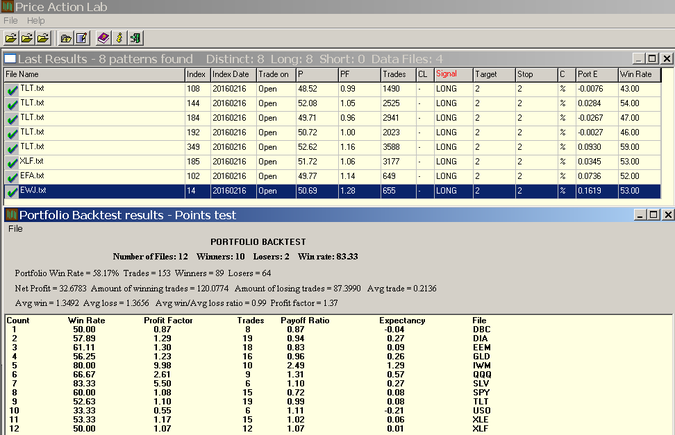
Below are the detailed results of a portfolio backtest of the pattern for EWJ on 10 popular ETFS:
Results are hypothetical and are NOT an indicator of future results. Please read the full disclaimer at the end of this article.
The portfolio profit factor is 1.37 while the EWJ pattern was profitable in eight of the ten ETFs. The combined sample size is 153 trades.
The portfolio backtest results indicate a potential edge in the case of the long pattern for EWJ.
5. Validation using robustness tests
This test uses variations in exits to measure robustness. The results are shown below:
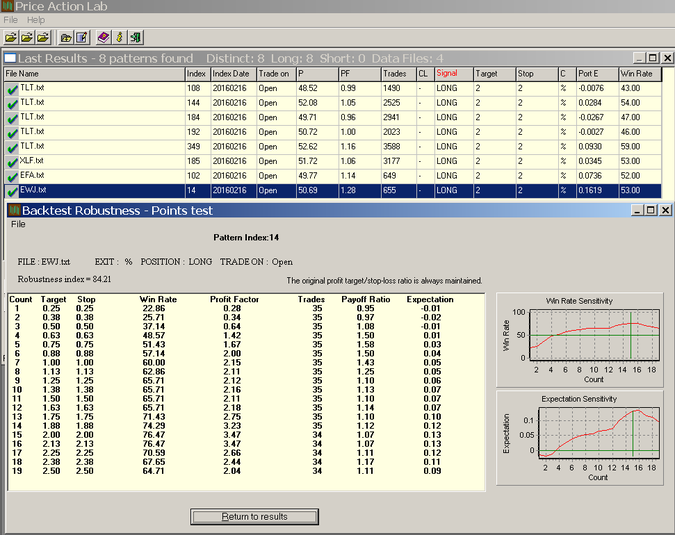
The profit target and stop-loss of 2% are varied so that they maintain their original ratio, in this case 1. The trade expectation curve is smooth and mostly rising and the Robustness Index is at 84.71 with 100 being the maximum.
Conclusion
Note that the presence of an edge does not guarantee that the next trade will be profitable. Edges are determined based on ensemble averages but profits are determined by time averages. Therefore, both the expectation and the probability of win are important. Price Action Lab provides an efficient platform for identifying and testing anomalies in price data for an edge but effective validation is both an art and a science.
Subscribe via RSS or Email, or follow us on Twitter.
Detailed technical and quantitative analysis of Dow-30 stocks and popular ETFs can be found in our Weekly Premium Report.


