


The mainstream financial media recently compared the 18 year period it took for Dow Jones to grow from 10,000 to 20,000 to the 85 or so years it took for a rise from about 60 to 10,000 and argued that milestones are reached faster nowadays. But analysis shows that if this is true, then the Dow Jones should have been at 30,000.
In markets we care about returns more than average speed. When returns are properly calculated, then a subtle fact is revealed: the Dow Jones grew at a faster annual rate in the 85 years from 1914 to 1999 than from 1999 to 2017.
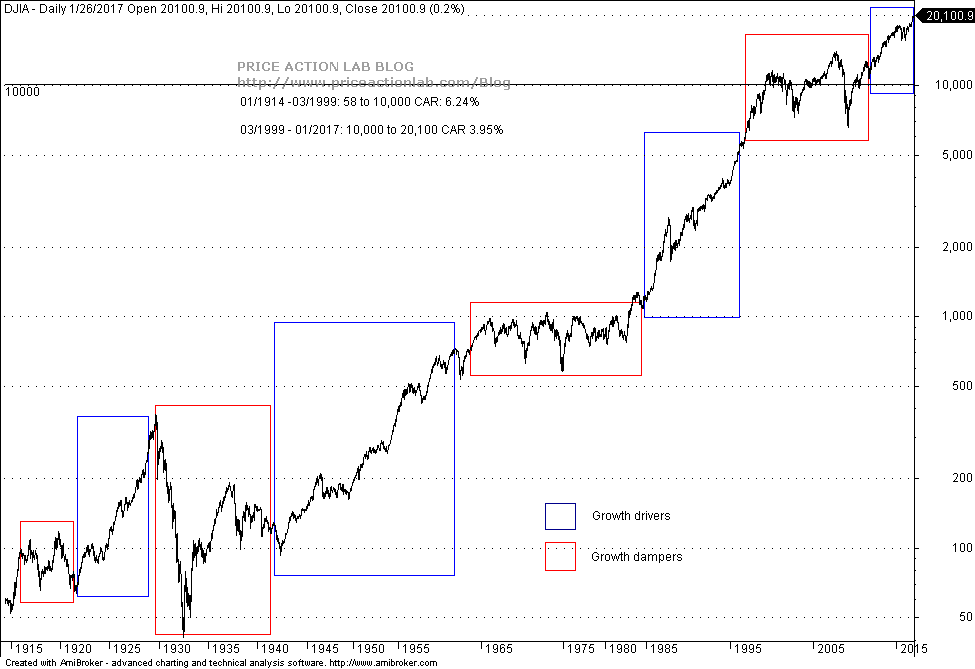
Markets rise longer-term because of growth drivers and fall, or move sideways, because of growth dampers. After 1999, there were two major growth dampers, the 2000 dot com crash and the 2008 financial crisis that slowed Dow Jones considerably. This is shown in the chart since 01/1914 below.
Below is a table with compound annual return calculations for the two periods compared in the financial media.
| Initial date | Initial price | Final date | Final price | Number of Years | CAGR |
| 01/1914 | 58 | 03/1999 | 10,000 | 85 | 6.24% |
| 03/1999 | 10,000 | 01/2017 | 20,100 | 18 | 3.95% |
It may be seen from the above table that in the 85 years from 58 to 10,000 the index grew 6.24% annually but in the subsequent 18 years from 10,000 to 20,100 it grew 3.95% annually. The lower annual return is due to the significant growth dampers due to two consecutive major bear markets after 1999.
Had the Dow Jones maintained it annual growth rate of 6.24%, it would be close to 30,000 today. The new growth drivers established by central banks after the financial crisis may accelerate growth so that the missed target is recaptured after a number of year. However, another growth damper could delay reaching the target.
There is no prediction made in the article. We simply say that had the longer-term growth rate before 1999 been preserved, the Dow Jones would have been near 30,000. Essentially, investors in the stock market after 1999 have received much lower returns than investors before that despite claims by financial media that milestones are reached faster. No one in the markets cares how fast a target is reached. It is the returns that matter.
Yes, it took about 85 years for the Dow to go from about 100 to 10,000 and only 18 years to go from 10,000 to 20,000 but the relative time is irrelevant because in the markets only returns count. Charts can impose illusions on those who ignore the math behind the moves. The numerous ruined chart traders of the last 30 years are proof of that.
Charting and backtesting program: Amibroker
Technical and quantitative analysis of major stock indexes and 34 popular ETFs are included in our Weekly Premium Reports. Market signals for position traders are offered by our premium Market Signals service
If you found this article interesting, you may follow this blog via RSS or Email, or in Twitter


