

We use the ensemble feature generation of DLPL PRO with weekly data of Dow-30 stocks to forecast weekly returns. The strategy based on the ensemble features has less drawdown but the same MAR ratio as buy and hold.
For an introduction to the ensemble features see “Example 2: Dow-30 ensemble history” in this article. Below we describe one way of using DLPAL to forecast weekly returns.
Step 1: Generate weekly adjusted data for all 30 Dow stocks since 1996
The calculation of the ensemble features will start at 01/2014 because we need enough weekly history for stocks like V and GS. A more advanced analysis should take into account index rebalancing.
Step 2: Use DLPAL PRO to calculate the ensemble features
The following workspace was used.
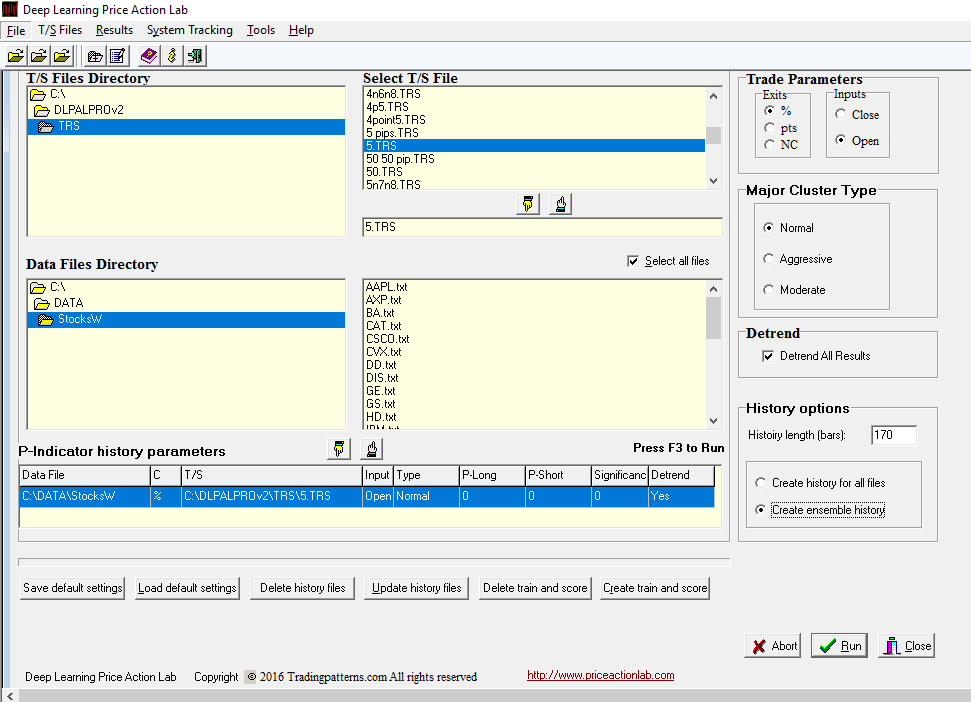
The percent profit-target and stop-loss used for the feature calculations were set at 5%, which is a reasonable value for historical weekly stock changes. A more complete study should involve calculations with different values for the exits and testing Next Close exit.
Step 3: Combine the ensemble data with SPY data
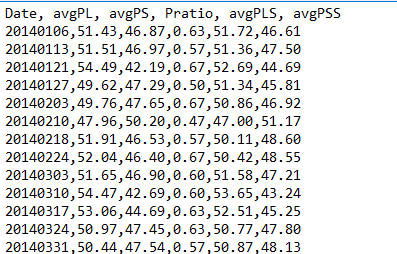
The ensemble file has the following format:
Date, avgPL, avgPS, Pratio, avgPLS. avgPSS
where avgPL is the average of long directional probabilities, avgPS is the average of short directional probabilities, Pratio is the number of securities with positive directional bias divided by the total number of securities, avgPLS is the significance-weighted avgPL and avgPSS is the significance-weighted avgPS. A screenshot of a portion of the file is shown below.
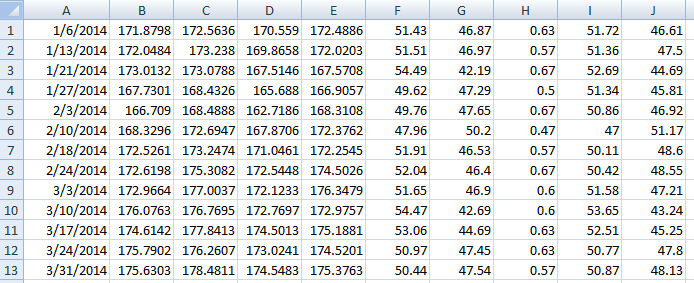
We combine the ensemble feature data with weekly SPY data in excel (.csv format) and we remove the header line. This is how the file looks:
Step 4: Import the file in Amibroker
One of the many advantages of Amibroker over other trading platforms is the easy of importing data of different formats and with different fields. Volume is avgPL, open interest is avgPS, AUX1 is Pratio and AUX2 is AvgPLS (not used.) Below is the SPY chart with the weekly features (Chart is shown as daily but prices are weekly.).

Step 5: Backtesting a strategy
We backtest a strategy of the following form:
Buy if Pratio > 0.50 and avgPL > 53
Short if Pratio < 0.50 and avgPS > 53
Below is the equity curve.
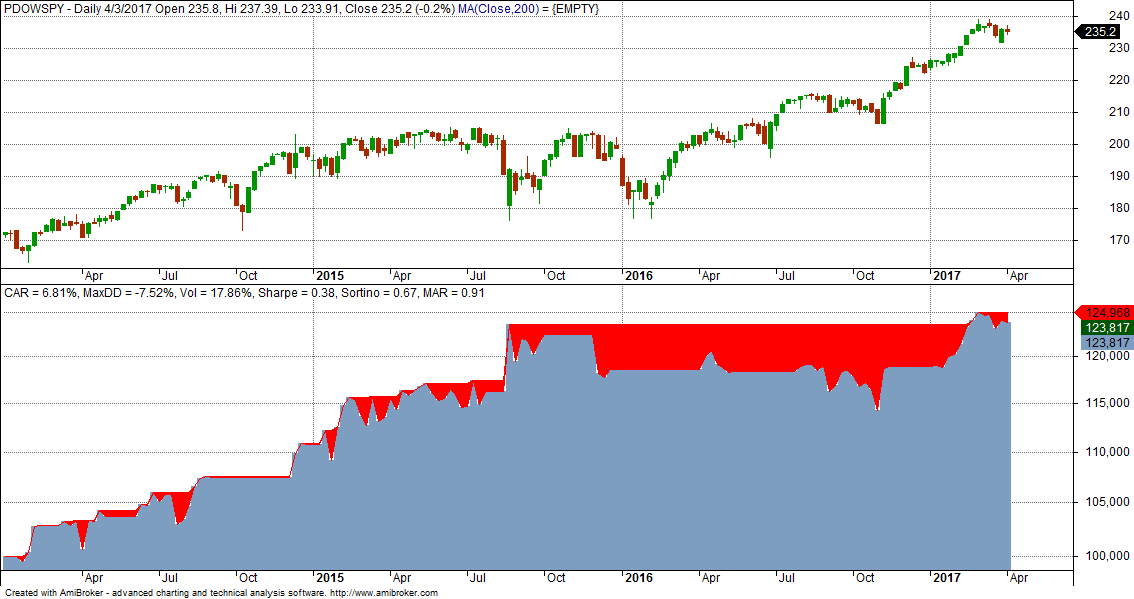
The strategy worked well in 2014 and 2015 (10% and 7%, respectively) but then was nearly flat in 2016 with 0.3% return. The YTD return is 4.1%. Below are some key metrics and comparison to buy and hold. Commission of $0.01 per share is included.
| Parameter | Strategy | Buy and hold |
| CAGR | 6.81% | 10.02% |
| Max. DD | -7.5% | -13% |
| Sharpe | 0.84 | 0.79 |
| MAR | 0.91 | 0.90 |
| Exposure | 55% | 100% |
Overall this is not a bad strategy but it needs improvement and should be maybe combined with some other strategy. The goal in this article was to offer an example of how the ensemble features are generated and used and not to develop a final strategy.
You can download a demo of DLPAL PRO here. For more articles about DLPAL PRO click here.
We also offer DLPAL LS, a version of the program specifically designed for hedge funds. More details can be found here.
If you have any questions or comments, happy to connect on Twitter: @priceactionlab
Strategy performance results are hypothetical. Please read the Disclaimer and Terms and Conditions.
Charts were created with Amibroker – advanced charting and technical analysis software. http://www.amibroker.com


