

We apply the PSI5 mean-reversion algo to Dow 30 stocks in the weekly timeframe. Since 2000 the strategy has outperformed S&P 500 total return on both absolute and risk-adjusted basis with and without a stop-loss.
Weekly mean-reversion signals for Dow 30 stocks are included in Weekly Signals and in Weekly Market Analysis.
With only one parameter adjustment in the PSI5 algo we use for daily mean-reversion with Dow 30 stocks we applied it in the weekly timeframe. Below are the results for all 30 Dow stocks with a 2% stop-loss and without it.
Portfolio backtest settings
Time-frame: weekly (adjusted data)
Strategy type: Mean-reversion, long-only
Score based on: PSI5
Universe: Dow30 stocks (current composition)
Backtest period: 01/03/2000 – 10/25/2017
Maximum open positions: 20
Commission per share: $0.01
Position size per stock: Available equity/20
Trade entry: Open of next bar after entry signal (no look-ahead bias)
Trade exit: Open of next bar after exit signal or 2% stop-loss (no look-ahead bias)
Performance summary
In the results below we compare the performance of the weekly strategy without and with stop-loss to buy and hold and also to daily mean-reversion based on PSI5
| Parameter | No stop-loss | 2% stop-loss | SPY B&H | Daily |
| CAGR | 9.29% | 7.12% | 5.15% | 7.51% |
| Max. DD | -34.4% | -24.4% | -55.2% | -19.8% |
| Sharpe | 0.46 | 0.43 | 0.26 | 0.59 |
| MAR | 0.27 | 0.29 | 0.09 | 0.37 |
| Win rate | 66.8% | 61.7% | – | 66.8% |
| Trades | 6275 | 6638 | – | 11028 |
| Avg. Trade | 0.55% | 0.40% | – | 0.36% |
| Avg. bars | 2.86 | 2.36 | – | 6.69 |
| Profit factor | 1.51 | 1.30 | – | 1.39 |
Note that the strategy without stop-loss was down 11.7% in 2008 and without stop-loss it was down 4.2%. Drawdown can only be decreased without curve-fitting by switching to daily timeframe. The daily strategy gained 4.6% in 2008.
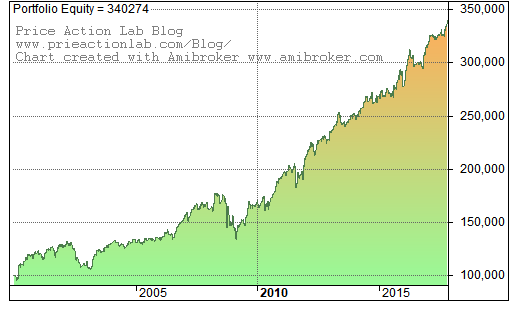
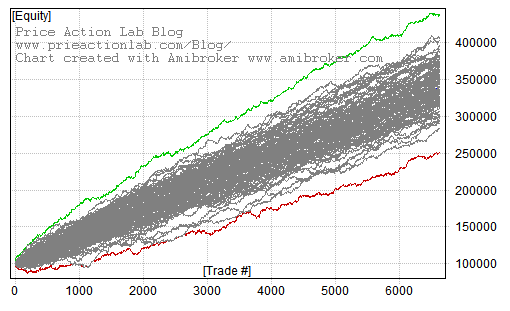
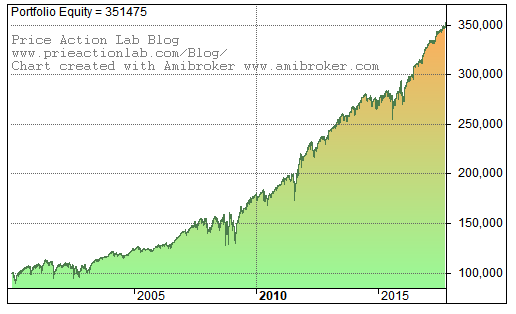
Below are the equity curve, monthly returns and Monte Carlo simulation for the weekly strategy without stop-loss.
 | 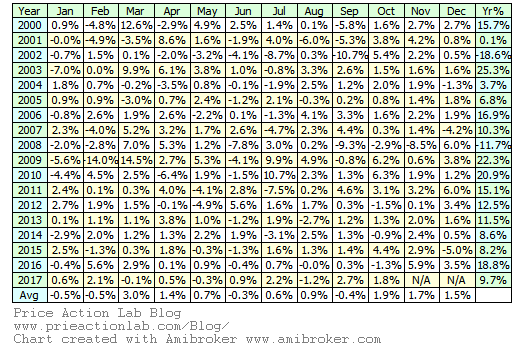 | 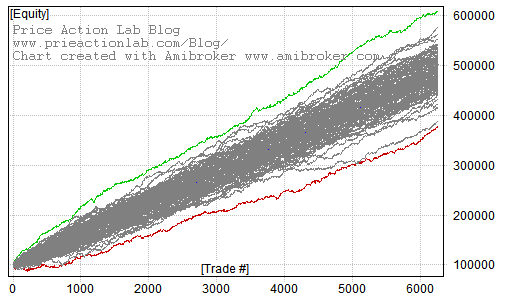 |
The probability of a drawdown greater than 14% is less than 1%.
Below are the equity curve, monthly returns and Monte Carlo simulation for the weekly strategy with 2% stop-loss.
 | 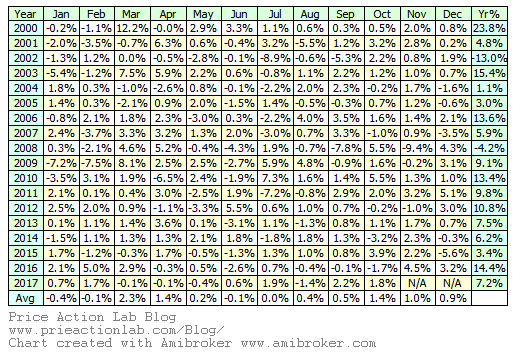 |  |
The probability of a drawdown greater than 13.5% is less than 1%.
Below are the equity curve, monthly returns and Monte Carlo simulation for the daily strategy without stop-loss.
 |  | 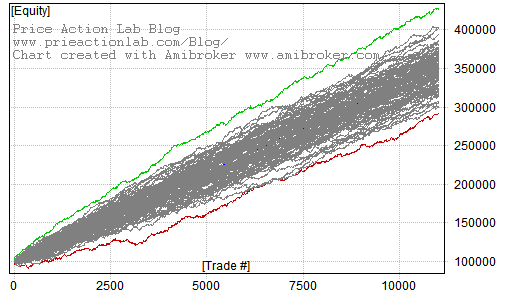 |
The probability of a drawdown greater than 7.5% is less than 1%.
The signals of the weekly mean-reversion strategy are included in our Weekly Market Analysis.
Disclaimer: No part of the analysis in this blog constitutes a trade recommendation. The past performance of any trading system or methodology is not necessarily indicative of future results. Read the full disclaimer here.
All charts were created with Amibroker – advanced charting and technical analysis software. http://www.amibroker.com
Copyright notice: Any unauthorized copy, reproduction, distribution, publication, display, modification, or transmission of any part of this report is strictly prohibited without prior written permission.


