


Since 2006 the compound annualized return of Apple stock is 27.36% with regular trading hours having a negative contribution. This price action anomaly vanished in 2016 but the reasons it worked for nearly 10 years are still not clear.
In October 2013 I wrote an article about the “Best Kept Secret In Wall Street” and the fact that all the gains in Apple stock were due to overnight changes while regular trading hours had a negative effect on the stock price. This price action anomaly became significant starting in 2006 and disappeared in 2015. Below is a chart that shows what has happened in more detail.
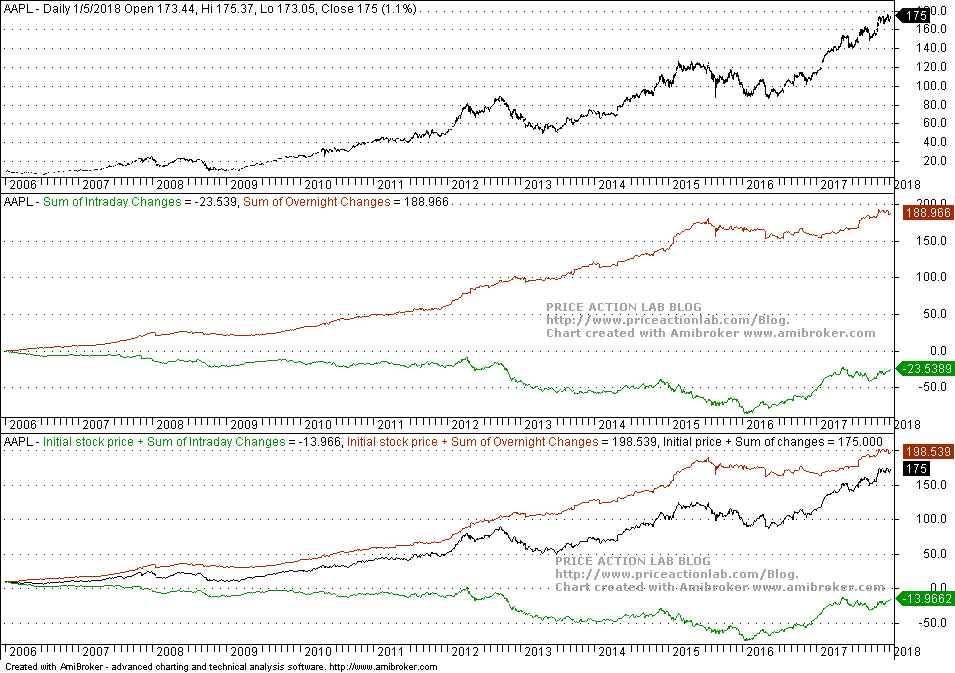
Since 2006, the sum of overnight changes (red line) is nearly $189 versus -$23.5 for intraday changes (green line), as shown in the first indicator pane of the above chart. From the second pane it may be seen that this persistent anomaly started to wane off in 2016 with the green line reversing direction while the red line remained flat.
The chart below shows the buy and hold return statistics and the equity curve of the trivial strategy of buying AAPL at the close and selling at the next open of every trading day. No commissions are included and equity is fully invested.
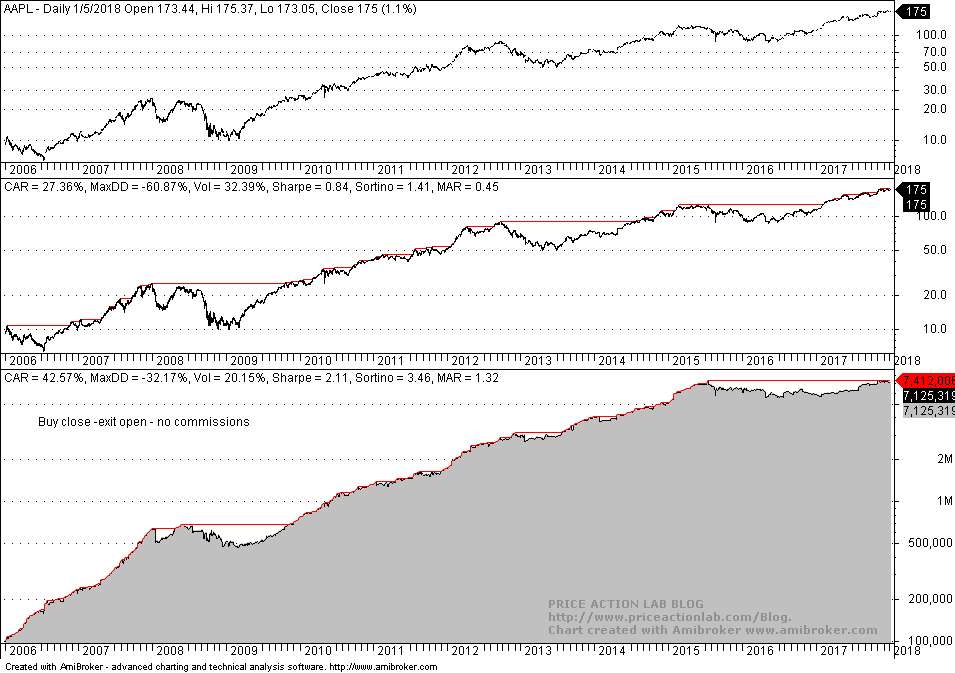
CAGR for the trivial strategy is 42.57% versus 27.36% for buy and hold. Risk-adjusted return for the strategy is significantly higher with Sharpe at 2.11 and MAR at 2.32 versus 0.84 and 0.45 for the buy and hold, respectively.
However, the above is theoretical performance and only illustrates the magnitude of the anomalous effect. In practice there is commission and slippage. In the backtest below we include $0.01 per share commission for fully invested equity.

After introducing commissions it may be seen that the trivial strategy performance is indistinguishable from buy and hold performance, i.e., there is no free launch. This means that it is unlikely that anyone profited from exploiting this price anomaly except during specific periods of time, like in 2013, when the effect was pronounced with the stock closing lower during the day after rising in overnight. Therefore, making money from this anomaly would require an additional level of sophistication in forecasting when the overnight would significantly outperform the day session. In hindsight of course this is easy to see when it occurred.
As noted above, this price anomaly started diminishing after 2016. Below is a backtest since 2016 with no commissions included.
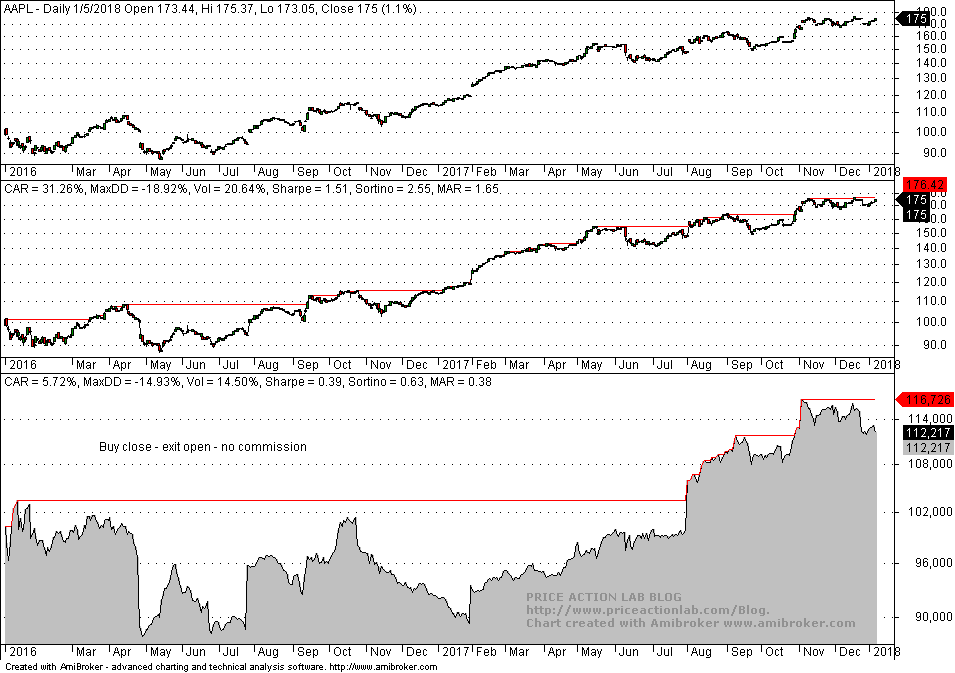
Although CAGR is 31.26% since 20016 for buy and hold, for the strategy of buying at the close and exiting at the next open it is only 5.72% and becomes about 0% if commission is added.
Note that this anomaly was also present in ETFs such as SPY for a long period of time, as it may be seen from the chart below, but after 2013 is started diminishing and it has completely disappeared by now.
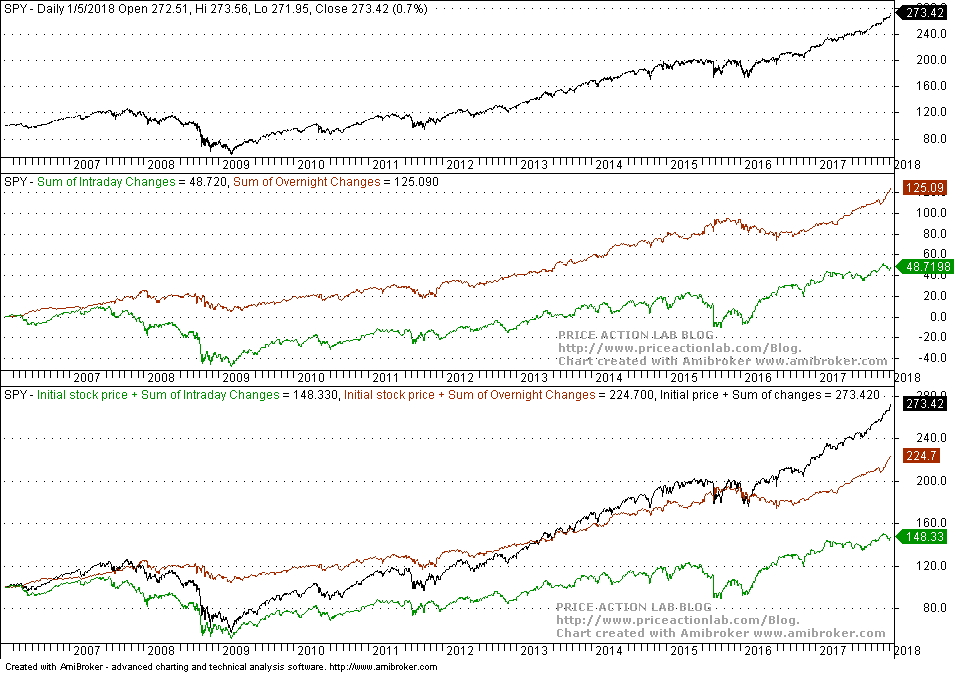
In 2013 the sum of intraday changes (green line) in the second pane of the above chart turned positive and at this point constitutes a large proportion of overall gains. Overnight gains (red line) still dominate but this is no longer a significant anomaly in price action but can be explained with simple reasoning, such as the fact that there is substantial volume of information generated outside of regular trading hours that impacts prices. In my opinion, as algo trading dominance increases, these anomalous price action effects will decrease further and then completely vanish.
Charting and backtesting program: Amibroker
Data provider: Norgate Data
Technical and quantitative analysis of major stock indexes and 34 popular ETFs are included in our Weekly Premium Reports. Market signals for position traders are offered by our premium Market Signals service
If you found this article interesting, you may follow this blog via RSS or Email, or in Twitter


