


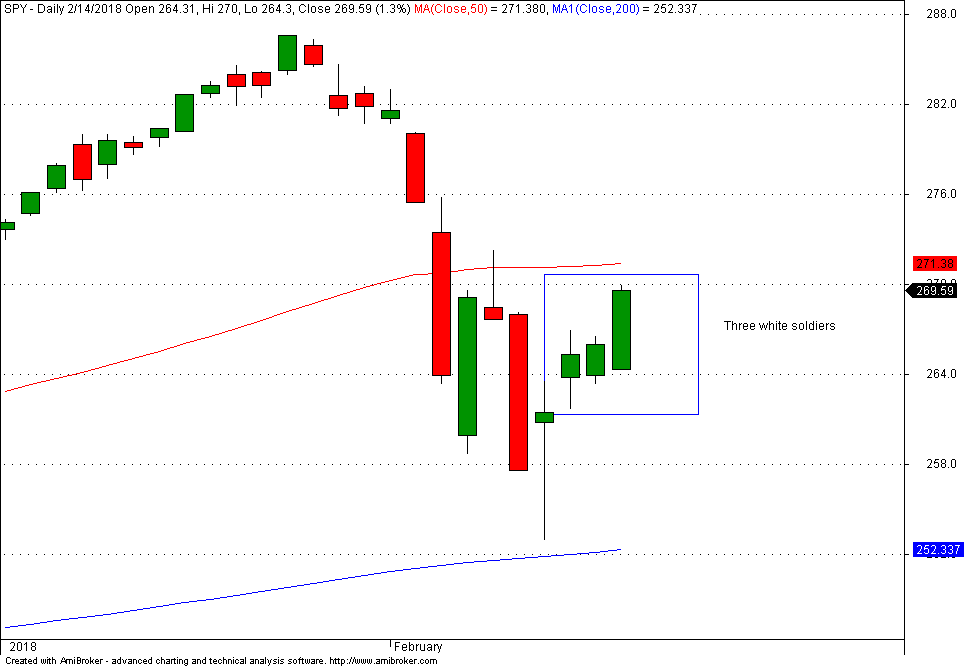
The three white soldiers is a candlestick pattern that has formed in SPY ETF and it is classified as a bullish formation. But does this pattern have any predictive power?
According to Investopedia:
“Three white soldiers is a bullish candlestick pattern that is used to predict the reversal of the current downtrend. This pattern consists of three consecutive long-bodied candlesticks that have closed higher than the previous day, with each session’s open occurring within the body of the previous candle.”
Here is the SPY chart with this candlestick formation:
I programmed this pattern in Amibroker AFL and tested it in SPY. I relaxed the formation conditions as much as possible because otherwise I could not get any valid occurrences. I used a time exit of 15 days as indicative of the predictive power of the formation but the results were similar for a wide range of time exits. I did not use a different exit because that could effect the essence of this pattern.
The samples are very low. For example, in SPY since inception there are three occurrences of this pattern.
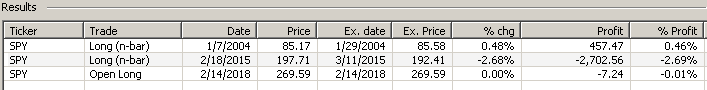
There is a large loss in February 2015 but this was a formation in an uptrend. If in addition it is required that this candlestick occurs after a correction, then the current formation is the only one in the history of SPY! Only one formation in 25 years worth of daily SPY data…
So how do we evaluate this formation? One way is by testing it on a group of stocks. Below are the results of a test on Dow 30 stocks with data in the period 01/03/2000 – 02/14/2018.

Source: Amibroker
There are only 20 occurrences of this pattern and the win rate for an exit of 15 bars is exactly 50%, i.e, a random pattern. This can be also seen from the equity curve.
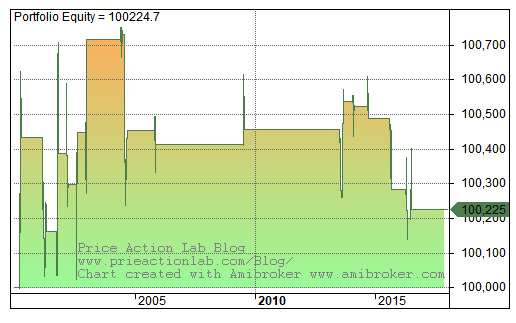
Note that the pattern appears random for a wide range of the time exit from 5 to 60 bars. The time exit is appropriate here because if another type of exit is used then we are talking about a different strategy and probably a curve-fitted one.
I also tested this on all current QQQ ETF constituent stocks. I found a sample of 73 occurrences from 01/03/2000 to 02/14/2018 with win rate for a wide range of exit bars in the range of 52% to 54%. In essence then, this is a random pattern.
An interesting question is then: why is anyone even paying attention to this and many other random formations?
This answer is a little complicated. At some point in the past the industry elevated to the status of experts some people that talked about these formations. The industry needed a story to sell to traders and market makers needed dumb money to profit from. People started using these patterns without even asking for proof that they worked. There were no backtests in books these and other formations were included and no references to expectation, win rate, etc. At the same time the industry made sure that anyone who pointed to these flaws was neutralized by not getting the same exposure. Most traders were in a hurry to getting rich and just accepted these patterns on face value. The results were not good for traders of course. For more information see my interview with John Navin for Forbes.
But there is worse. Even if the expectation and other statistical properties of patterns are known they can still lose any predictive power. A lot of work is required to assure that a trader is not being fooled by randomness. For example, DLPAL S and DLPAL DQ identify a large super-set of candlestick formations but these must be validated with appropriate tests to minimize the probability of Type-I error (false positive).
Evidence-based analysis shows that none of the patterns of classical technical analysis (head and shoulders, triangles, etc.) posses predictive power in addition to most candlestick patterns when applied to the price action context they are intended for. Maybe one reason that these formations are now random is because they were arbitraged out already. Many price action anomalies still exist but do not usually map to nice symmetrical and intuitive formations such as the three white soldiers.
If you found this article interesting, I invite you to follow this blog via any of these methods: RSS or Email, or follow us on Twitter
If you have any questions or comments, happy to connect on Twitter: @mikeharrisNY
Charting and backtesting program: Amibroker
Quantitative analysis of Dow-30 stocks and 30 popular ETFs is included in our Weekly Premium Report. Market signals for longer-term traders are offered by our premium Market Signals service. Mean-reversion signals for short-term SPY traders are provided in our Mean Reversion report.


