


Although hundreds, if not thousands, of academic papers on the performance of various price anomalies are published every year, equity curves are hard to find in many of them. Equity curves are a useful result for practitioners and traders with skin-in-the-game.
Equity curves are not only missing from many academic publications but also from the reports of some hedge fund departments that appear to like the academic format. Specifically, I read a report on price momentum a few days ago by a hedge fund and I could not find even one equity curve in it. Despite the fact that the report was an exercise in futility via curve-fitting with useless results for any practical purposes, the lack of equity curves was peculiar, to say the least.
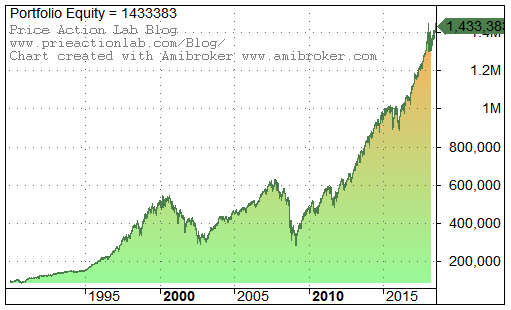
Equity curves show the increase in equity of an investment strategy as a function of time. This is the most valuable data visualization for people with skin-in-the-game. Equity curves provide a visual indication of the smoothness of returns. You don’t want the bulk of the returns in a 30-year period backtest, for example, to be concentrated in the first 5 years. Equity curves, along with basics metrics derived from them, for example the maximum drawdown, Sharpe, CAGR, etc., allow quick screening of strategies by practitioners. Below is an example of the equity curve of S&P 500 total return buy and hold for $100K initial capital from 01/03/1990 to 07/27/2018.
Next, consider a 2_12 price momentum strategy where on a monthly basis we go long the top 20% stocks and short the bottom 20%. The 2_12 means that we rank stocks based on the price change from the end of the previous month to the end of 12 months ago and rebalance the portfolio at the close of the current month. The backtest period is from 01/02/1990 to 07/27/2018 and the universe considered for this example is the current composition of Dow 30 stocks for practical purposes only. There is no commission included but the impact of friction in the monthly timeframe for this example is in the order of 100 basis points for the whole period. This impact varies depending on number of stocks and timeframe.
Performance comparison
| Parameter | Strategy | Buy and hold |
| CAGR | 9.23% | 9.76% |
| Max. DD | -34.30 | -55.2% |
| Sharpe | 0.68 | 0.56 |
| MAR | 0.27 | 0.18 |
We just found a strategy based on the “indisputable” momentum anomaly that has outperformed S&P 500 total return on a risk-adjusted basis.
Probably many PhD degrees have been awarded for what practitioners have been doing more carefully and meticulously since the 1980s. You may read in related academic papers naive statements about the momentum anomaly, such as :
- It is significant
- It captures the bulk of the alpha
- It is persistent
- It will probably never go away
CLAP CLAP CLAP…..
But equity curves are often missing from papers and reports. Let us look at the one of the above 2_12 momentum strategy:
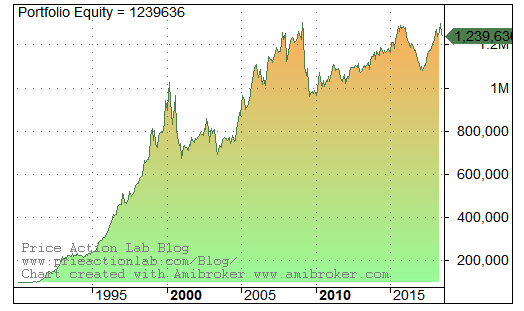
No practitioner would ever trade this equity curve, not even the newbies.
When I read academic papers and hedge fund reports about strategies that show no equity curves a few things cross my mind that may not be necessarily the case:
- Naive
- Deception
- Irrelevant
I hope no one invests money with people that show no equity curves, no one. I also hope that no one takes seriously academic papers that show no equity curves. Even when equity curves are shown and they look good, they must be evaluated for the impact of data-mining bias and over-fitting.
More articles related to academic work on trading strategies
- How Some Academics Misguide Traders And Hedge Funds
- Traders Should Stay Ahead Of Academic Research
- Academic Research Causes Crowding Effect
If you found this article interesting, I invite you follow this blog via any of the methods below.
Subscribe via RSS or Email, or follow us on Twitter
If you have any questions or comments, happy to connect on Twitter: @mikeharrisNY
Charting and backtesting program: Amibroker
Technical and quantitative analysis of Dow-30 stocks and 30 popular ETFs is included in our Weekly Premium Report. Market signals for longer-term traders are offered by our premium Market Signals service.
a


