


Backtests on a portfolio of securities, including anti-correlated ones, are used in this article in place of out-of-sample validation via a specific example of trading strategy development.
Out-of-sample testing limitations
Out-of-sample testing offers a genuine validation method if, and only if, the hypothesis tested is unique and not the outcome of multiple comparisons. In addition, out-of-sample testing provides an unbiased estimator of future performance if, and only if, it is used only once with one hypothesis, otherwise the out-of-sample turns into in-sample.
In practice, none of the above conditions hold and out-of-sample tests do not provide unbiased estimates of future performance but are biased by data-snooping.
In the case of financial time series, out-of-sample tests deprive the training set from important market conditions since there is data partition to accommodate for a validation sample. Therefore, we have concluded that alternative tests must be used while the whole price history must be made available to strategy design. In our book Fooled By Technical Analysis we introduced portfolio backtests on comparable securities. Our argument is that a strategy must perform at least marginally on a portfolio of ex-ante selected securities. A stricter test involves testing performance on comparable anti-correlated securities; for example, if the strategy is about bonds, it must also work at least marginally on stocks; otherwise the strategy does not capture essential features of price action but over-fits on what could be described as noise.
An example
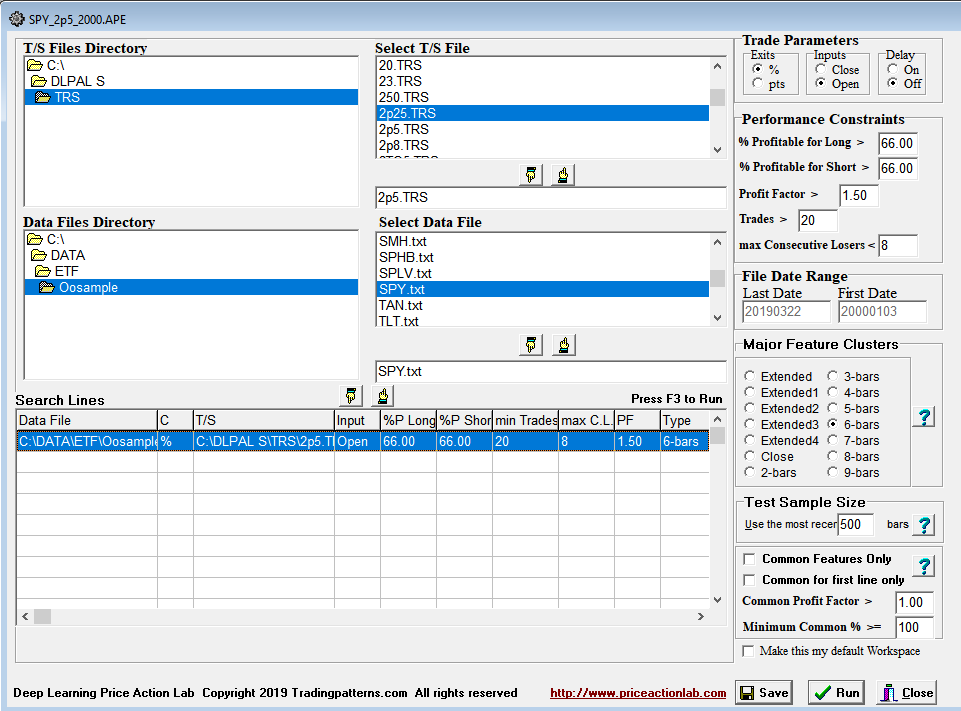
We use DLPAL S software in this example to develop a strategy for trading SPY ETF. We use daily data from 01/03/2000 to 03/22/2019 because data before 2000 are no longer representative of prevailing market conditions. For this example we select the 6-Bar major feature cluster, meaning that the features (predictors) that will be constructed from the data will be based on 6 daily bars. We also use 2.5% profit target and stop-loss for evaluating feature performance. All other settings are shown on the DLPAL S workspace below:
Results
Below are the results of the search for price action anomalies (price patterns.)
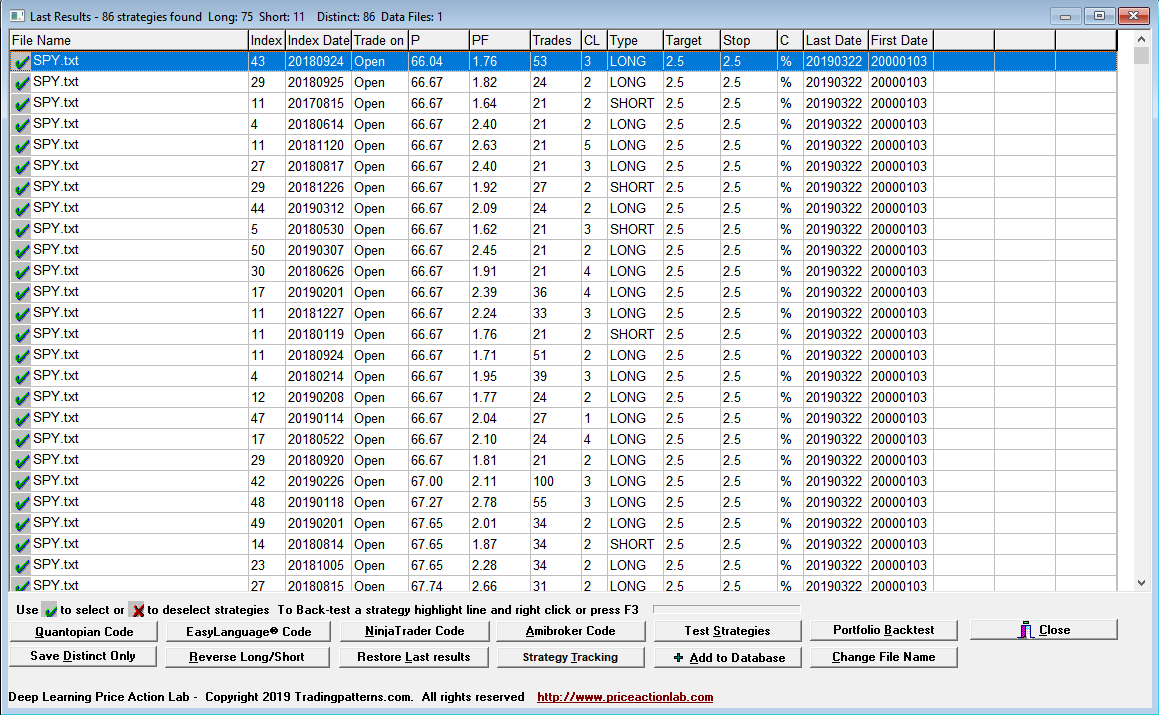
Each line in the results is a strategy that satisfies the performance parameters specified on the search workspace. Index and Index Date are used internally. Trade on is the entry point, in this case the Open of next bar. P is the success rate of the strategy, PF is the profit factor, Trades is the number of historical trades, CL is the maximum number of consecutive losers, Type is LONG for long strategies and SHORT for short strategies, Target is the profit target, Stop is the stop-loss and C indicates whether % or points for the exits, in this case it is %. Last Date and First Date are the last and first date in the data file.
DLPAL S identified 86 distinct strategies, 75 long and 11 short, which satisfied the performance parameters defined on the workspace.
Validation and selection
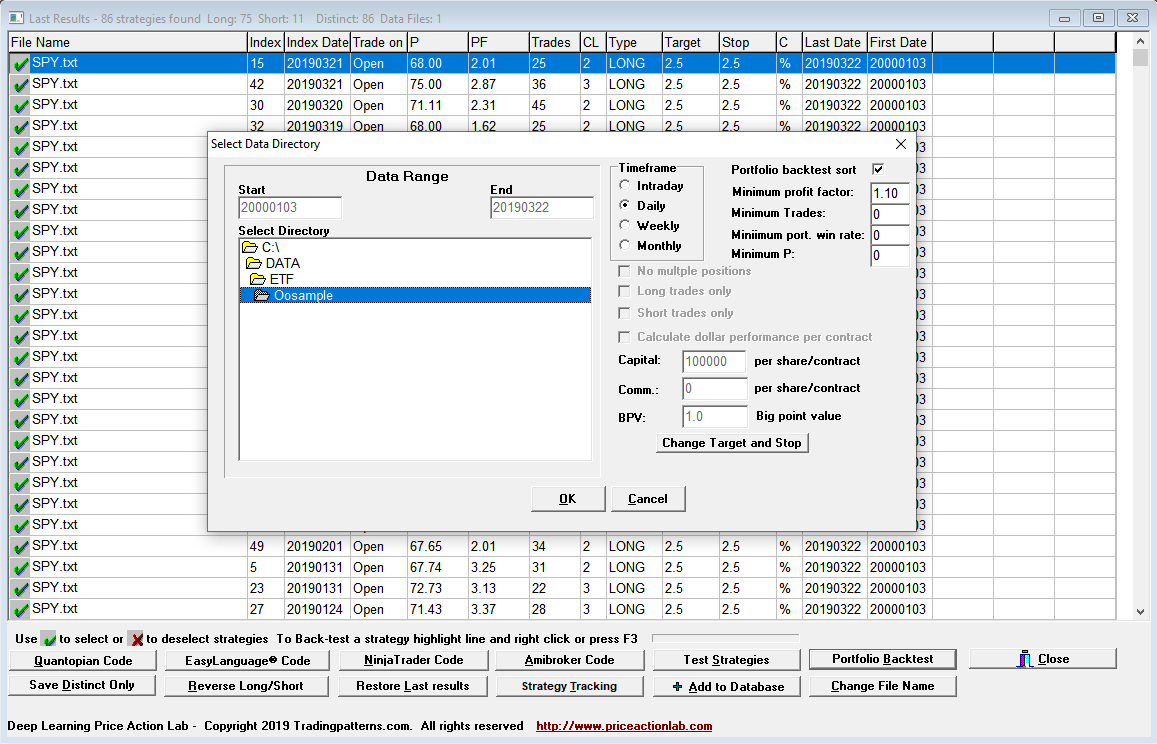
The portfolio backtest tool of DLPAL S is sued next to backtest each strategy on a portfolio of 34 ETFs (including SPY) in the same data period. We also instruct the program to select the strategies with a portfolio profit factor greater than 1.1, as shown below:
Below are the results of the portfolio backtest.
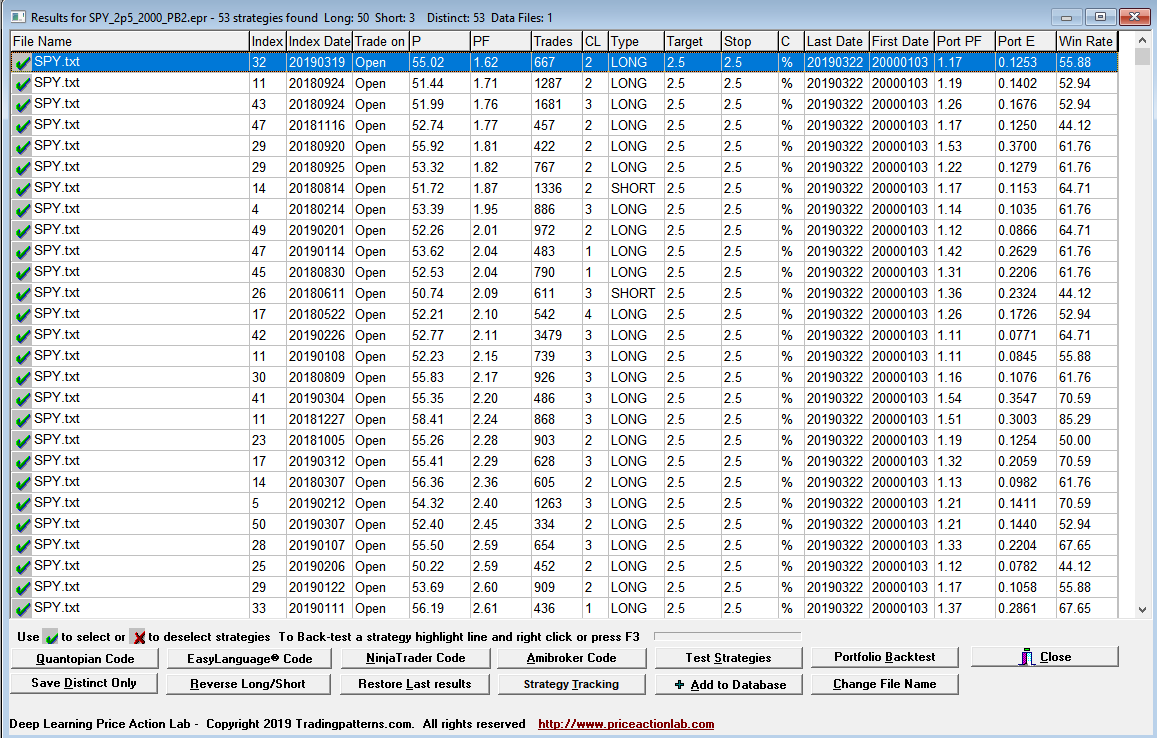
There are 53 strategies, 50 long and 3 short that with portfolio profit factor greater than 1.1. We select those strategies to build a system.
Backtesting
DLPAL S generated system code for Amibroker by combining the 53 strategies with Boolean OR. All backtests include commission of $0.01 per share and equity is fully invested.
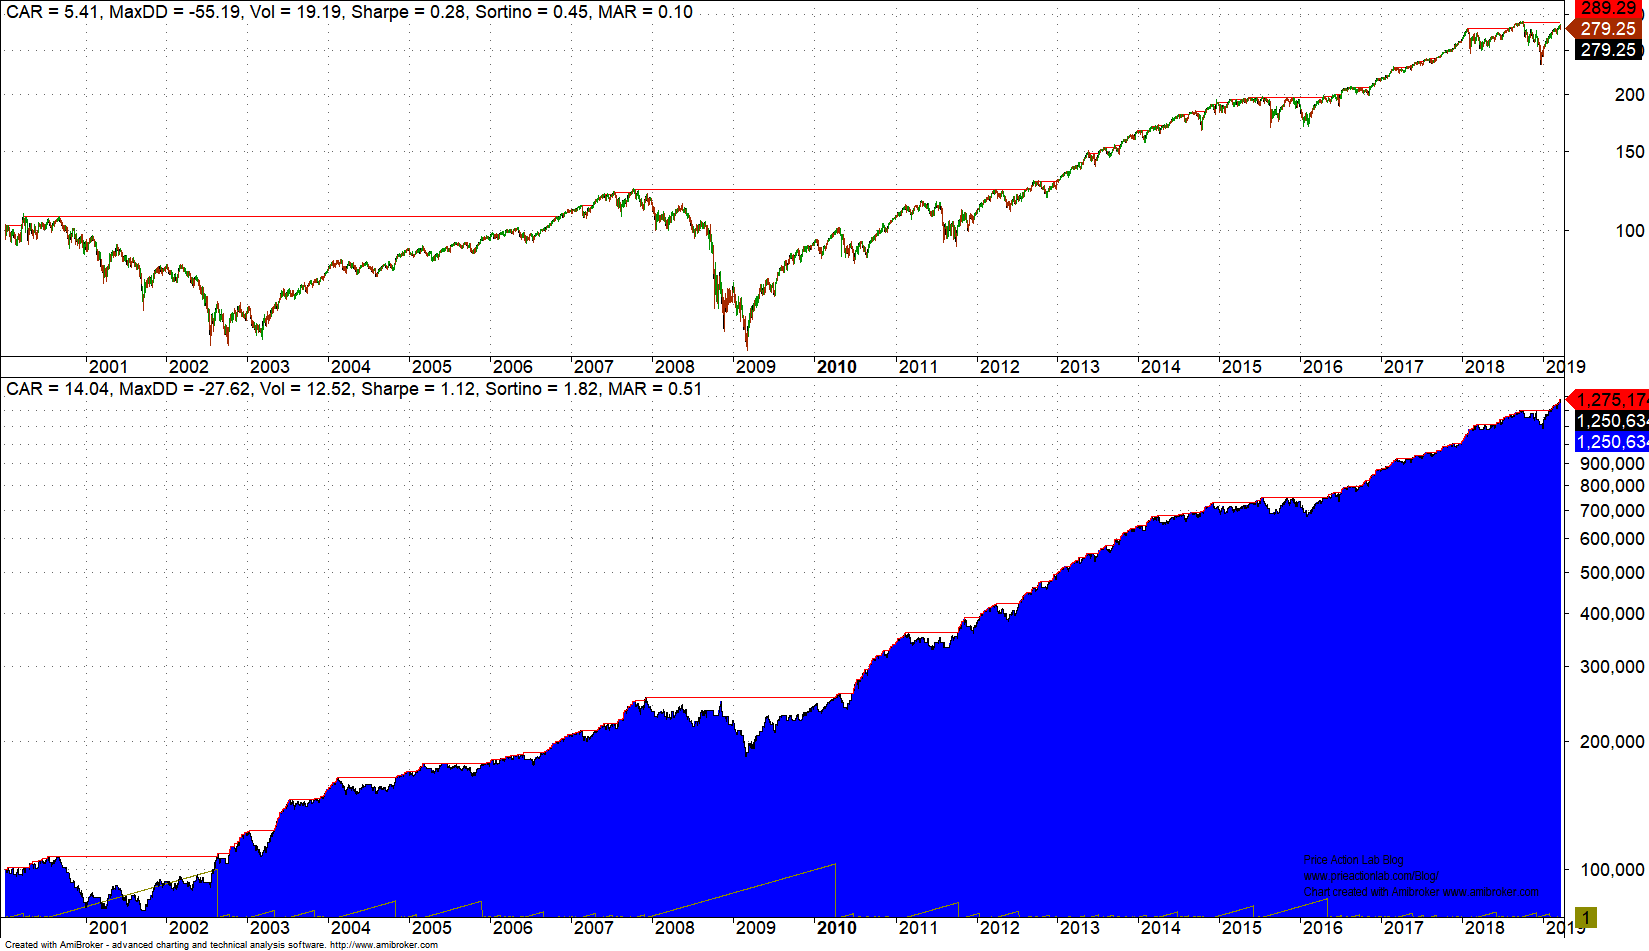
SPY backtest
Naturally, we expect the SPY backtest to show good performance since the strategies to build a system are already selected from a list winning strategies.
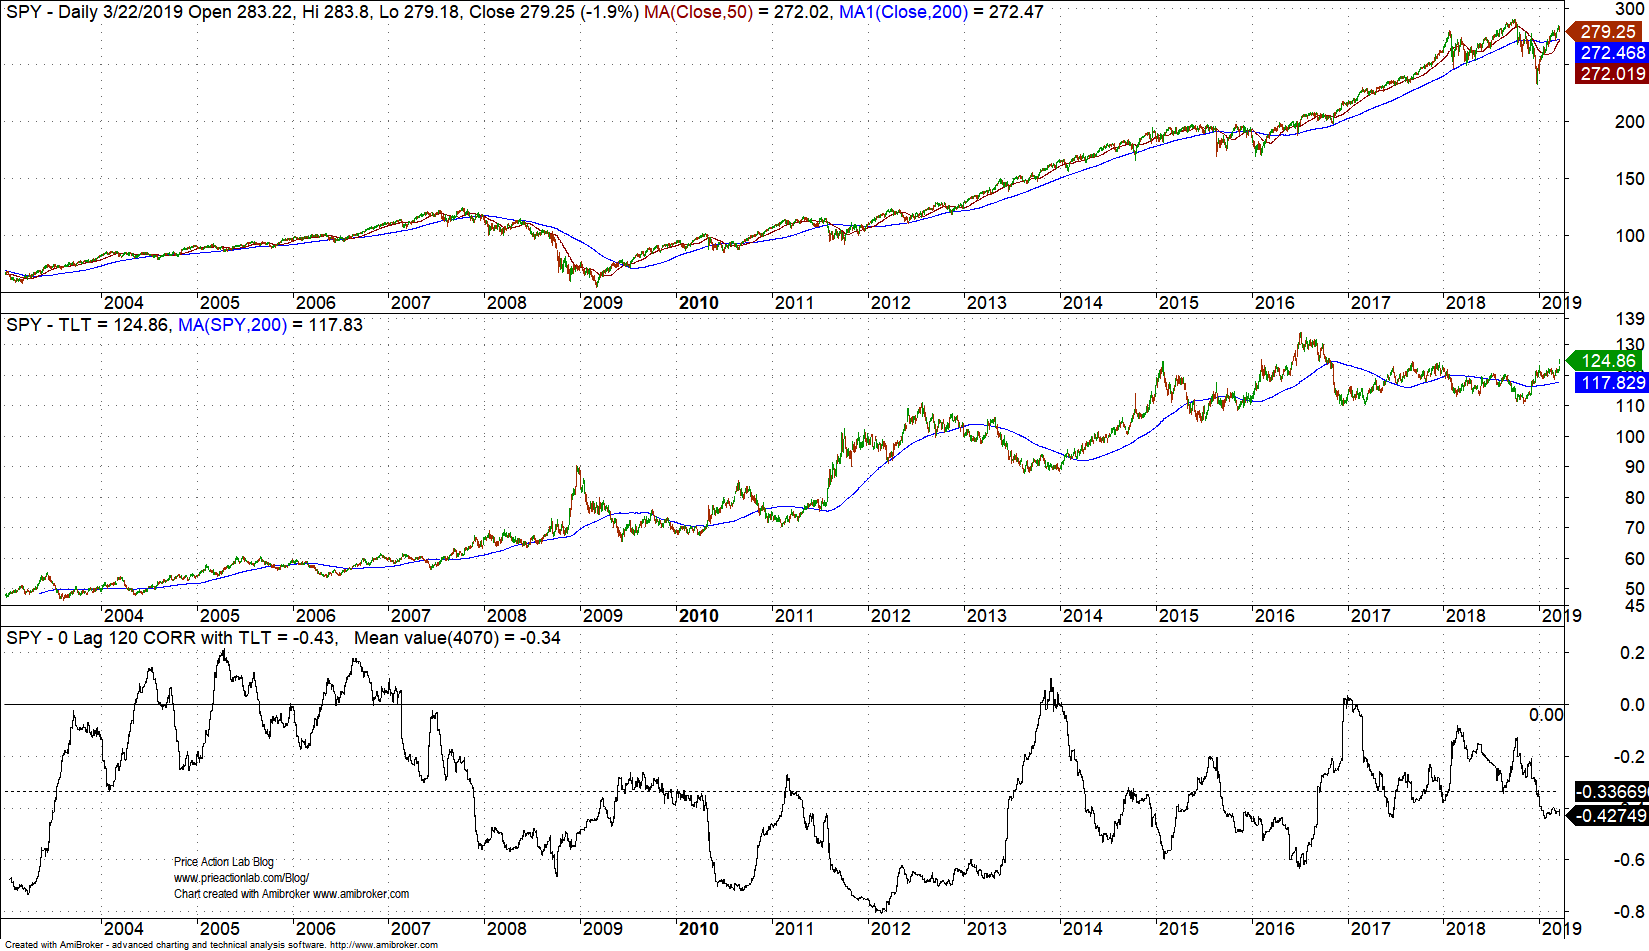
As expected, the performance is outstanding but for validation purposes we select an anti-correlated security, TLT ETF, to run a backtest. Note that since TLT ETF inception, the average 0-lag, 120-day correlation with SPY is -0.34, as shown below.
TLT Backtest
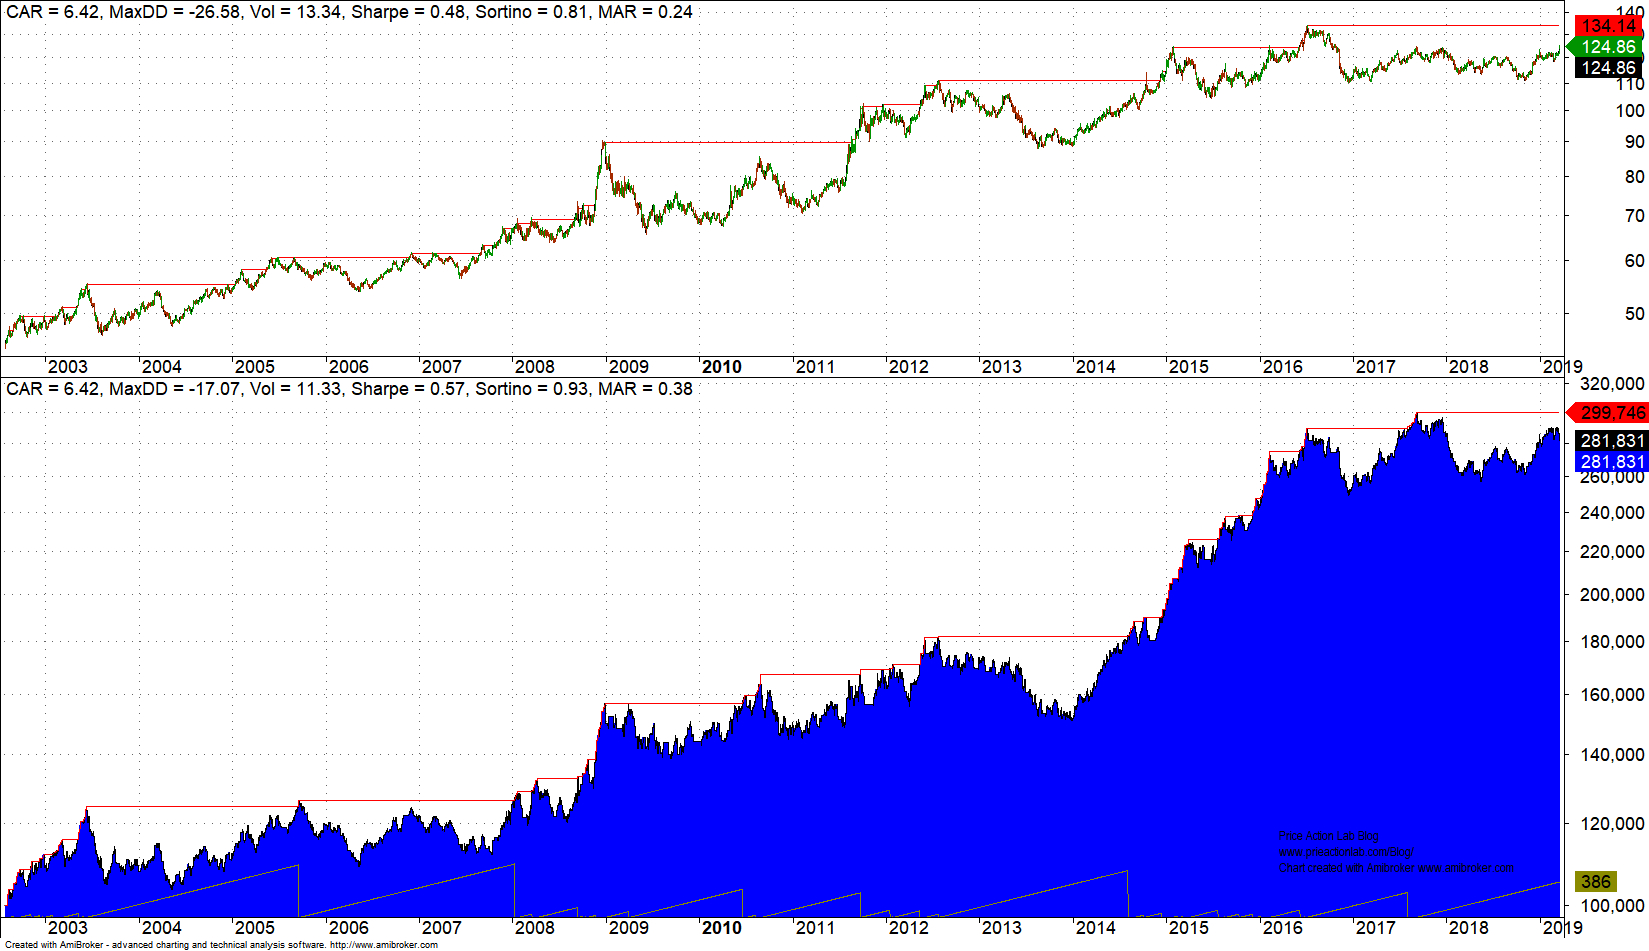
CAGR for the system matches buy and hold CAGR but risk-adjusted performance is better since maximum drawdown for the system is lower: MAR for buy and hold is 0.24 versus 0.38 for the system. Therefore, performance on anti-correlated security exceeds our expectation.
DIA Backtest
Below is a backtest on a comparable (also correlated) security, DIA.
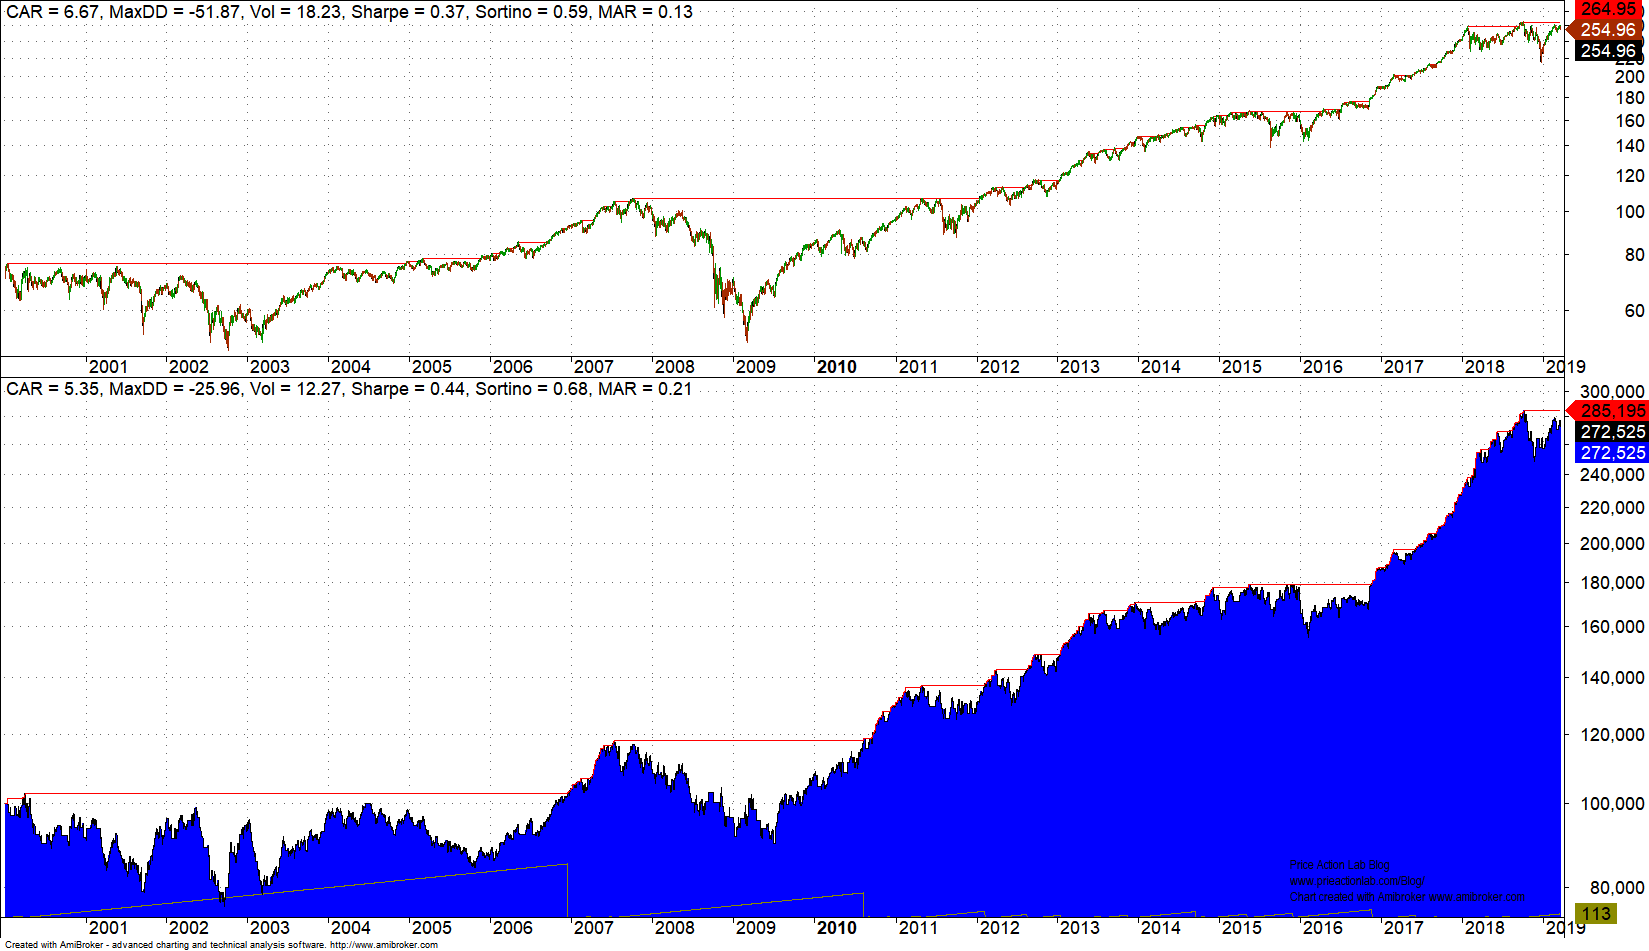
Although CAGR is lower, risk-adjusted performance is higher due to lower drawdown for the system. This backtests also exceeded our expectations.
Conclusion and FAQ
Often it may be better to avoid out-of-sample tests and perform alternative validation tests, especially when the features are identified from the data, i.e., there are multiple comparisons involved. If the alternative validation tests show good performance, especially with anti-correlated securities, there is high probability the designed system has some intelligence in timing the market.
How long will strategies remain profitable?
This is unknown and usually depends on market conditions. The real value in using tools such as DLPAL S is that the process can be repeated every six months to a year and the strategies can be updated.
Can a software tool make a trader a lot of money?
Software tools do not make any money. It is the understanding of properly using a tool and the hard work someone puts that often makes the money. One can use a tool such as hammer to make a house or vandalize a work of art.
You can request a free demo of DLPAL S here. For more articles about DLPAL S click here.
If you have any questions or comments, happy to connect on Twitter: @priceactionlab
Subscribe via RSS or Email, or follow us on Twitter.
Disclaimer: No part of the analysis in this blog constitutes a trade recommendation. The past performance of any trading system or methodology is not necessarily indicative of future results. Read the full disclaimer here.


