


The S&P 500 is up seven days in a row. Are these 7-day win streaks random or significant patterns? Here is a little experiment in R to answer this question.
Below is a chart of S&P 500 since 1960 with our Winning Streak indicator shown in bottom pane. This indicator assumes a value of 100 if there is a win streak in the period specified.
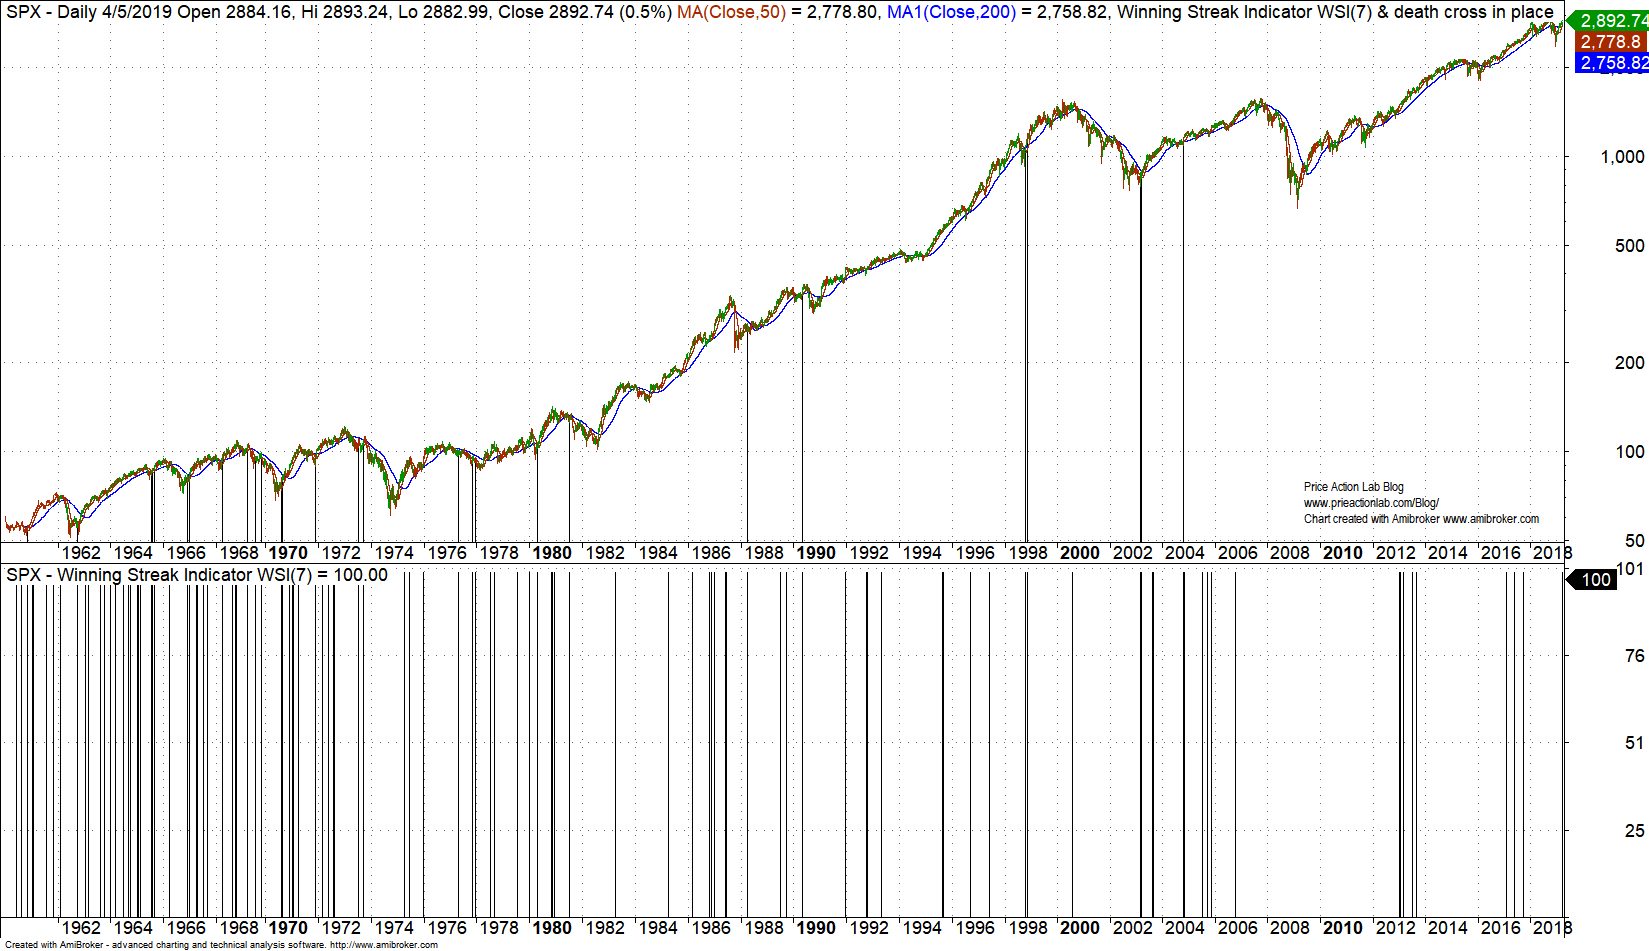
The lines on the price chart above show only those occurrences of a 7-day win streak while a death cross was in place i.e., the 50-day moving average was below the 200-day moving average. There are in total 198 occurrences of a 7-day win streak and only 43 of those have occurred along a death cross. In fact, these win streaks have occurred along uptrends and downtrends; are they random?
Since 01/1960 and up to yesterday, March 8, 2019, there are 14,916 daily bars in S&P 500. We perform an experiment of tossing a fair coin 14,916 times and count how many times a 7-day win streak comes up. We repeat the experiment 200 times, The results after coding the experiment in R are shown below:
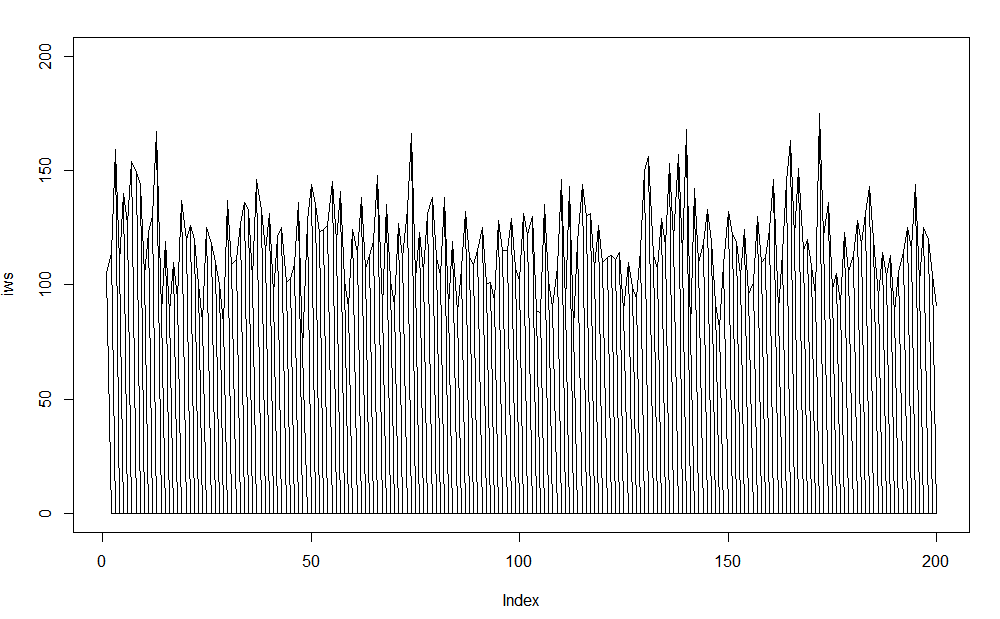
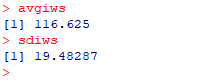
The average of the 200 repetitions is about 117 and the standard deviation is about 19.
Therefore, the realized number of 7-day win streaks of S&P 500, which is 198, is larger than the 3-standard deviation upper band at about 175.
However, there is no large divergence between realized and expected normally-bound. The difference can be attributed to the longer-term upward drift of the index. If the realized number was 300 for example, then we could talk about the possible emergence of a significant pattern.
In fact, before 2000 this 7-day pattern had a bullish bias depending on holding period but afterwards performance is flat as shown in the backtest below where we buy the index (hypothetically) if a 7-day win streak occurs and sell after 21 days.

Before 2000, a 7-day win streak was significant indicator of momentum depending on holding period possibly due to high serial correlation in daily returns. Note that the shorter the trade holding period, the flatter becomes the equity curve to the left. For example, for 5 days holding period, the flatness extends to around 1970. The reverse effect is observed if the holding period is increased; for 60 days the flatness starts at 2004.
The conclusion is that even if this 7-day win streak pattern was significant in the past, in recent years it is a random signal, probably caused by algo trading. The same holds for all classical analysis indicators as I have explained in a Forbes interview.
If you found this article interesting, I invite you follow this blog via any of the methods below.
Subscribe via RSS or Email, or follow us on Twitter
If you have any questions or comments, happy to connect on Twitter: @mikeharrisNY
Charting and backtesting program: Amibroker
Market signals from systematic strategies are offered in our premium Market Signals service. For all subscription options click here.
Premium articles subscriptions are available. Click on image for more details.


