

After the close of Friday, June 28, 2019, quant analysis generated an unusually strong bullish signal for the following week. The S&P 500 rose to new all-time highs the following Monday, July 1, 2019 and gained 1.7% on the week.
Our quant analysis is based on idiosyncratic indicators based on ensembles of signals generated by price action anomalies. These indicators are similar to sentiment signals but in our opinion are more robust and carry less noise.
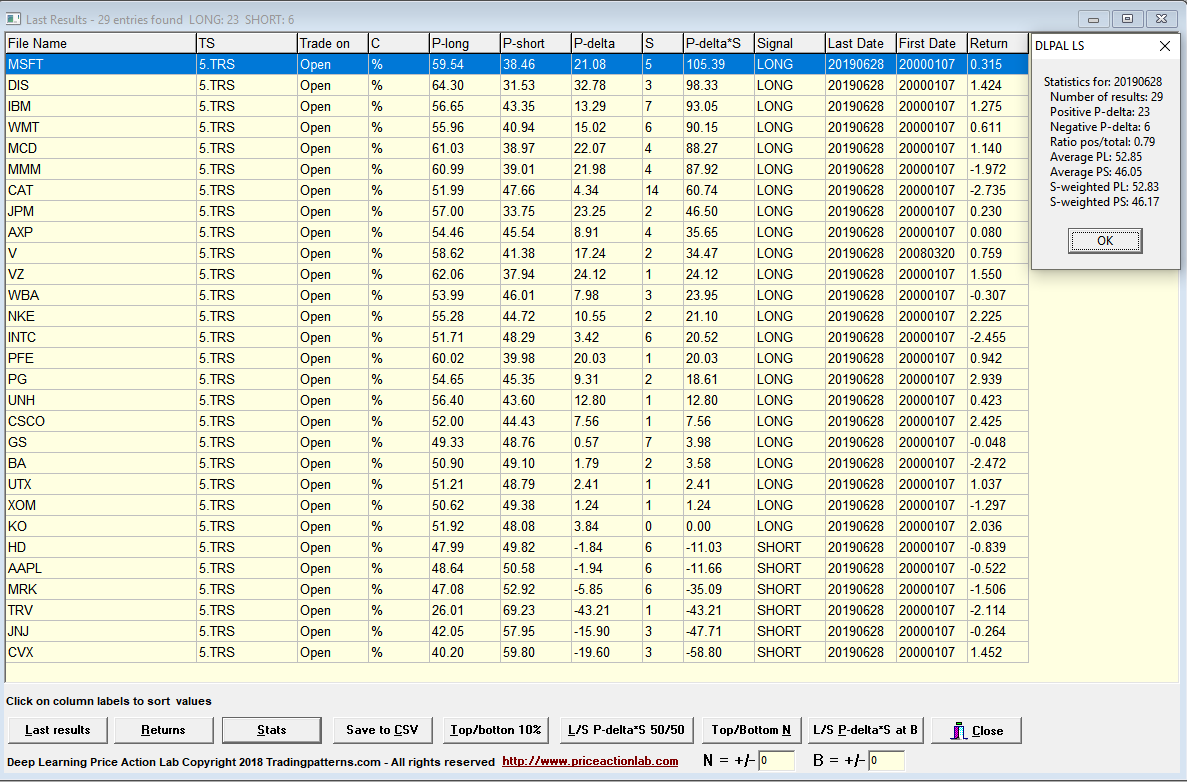
One of those idiosyncratic indicators is derived from the weekly directional bias of Dow 30 stocks (now Dow 29 after the replacement of DWDP by DOW due to lack of historical data for the latter.) This indicator is calculated by DLPAL LS software.
The indicator is calculated as the fraction of stocks with positive weekly directional bias in Dow 29. As of the close of Friday, June 28, 2019, the fraction rose to 0.79 (23/29), a number that is unusually high.
DLPAL LS can also generate historical series of this particular indicator for backtesting purposes along with a number of other indicators for individual securities that can be used for developing directional and long/short strategies. Fop more details click here.


