


In this brief article we answer the following question: Is price action in commodities markets more closely linked nowadays to price action in the stock market due to financialization?
The financialization argument is about increased trading activity in commodities linked to increased volatility and price trends. Another popular interpretation of financialization especially among traders is that new products, such as ETFs, linked to commodity markets tend to follow equity markets and thus distort price discovery in futures and spot markets. However, as with many claims in trading, the evidence is rarely offered but truth rests on presumed “authority.”
In this article we try investigate the presence of a link between commodities and equities due to fictionalization in the simplest way possible.
We consider two ETFs: DBA and DBC. The former ETF focuses on agricultural commodities and the latter on energy commodities.
Then we determine the percentage of same direction moves of the ETFs with SPY in daily and weekly timeframes. For daily we consider 252 trading days and for weekly we consider 40 weeks. Below are the results with comments. All charts start at DBA and DBC inception and end on October 3, 2019.
Daily DBA and SPY

Maximum was 69.8% in 2012 for same sign daily moves and then a downtrend in this indicator started to a minimum of 44.8% in 2014. Last value is 52.7%. There is no sustainable trend in the indicator and volatility is high. The above chart offers the impression that financialization impacted daily coupling of these markets but possibly the third round of quantitative easing caused decoupling. Of course these are hypotheses and probably cannot be proven. But the chart does not reveal any sustained coupling.
Weekly DBA and SPY
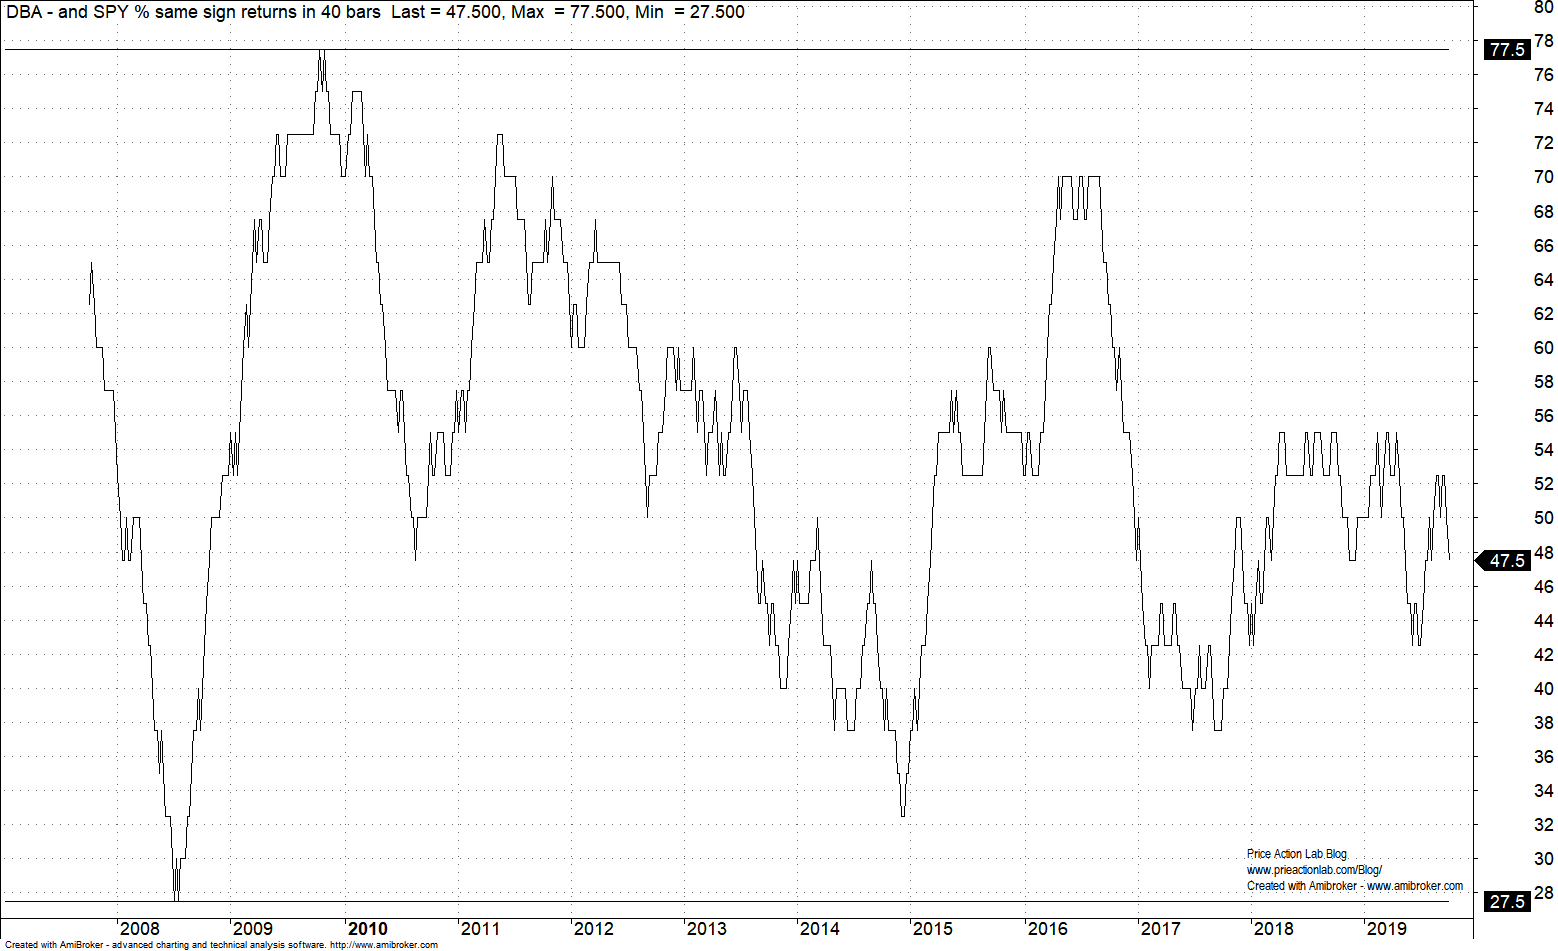
In the weekly chart, the minimum occurred in 2008 and the maximum in 2009. Current value is below 50%. Note that in 2015 the indicator came close to minimum value.
Daily DBC and SPY

The above chart shows persistent uptrend in coupling of daily returns with intermittent correction from 2007 to mid 2012. In 2015 the indicator reached close to the minimum but stayed slightly above 50%. Since then there are high swings and current value is about 60%. In this case there is a small effect possibly due to listings of energy companies in equity markets. However, there is no clear trend.
Weekly DBC and SPY
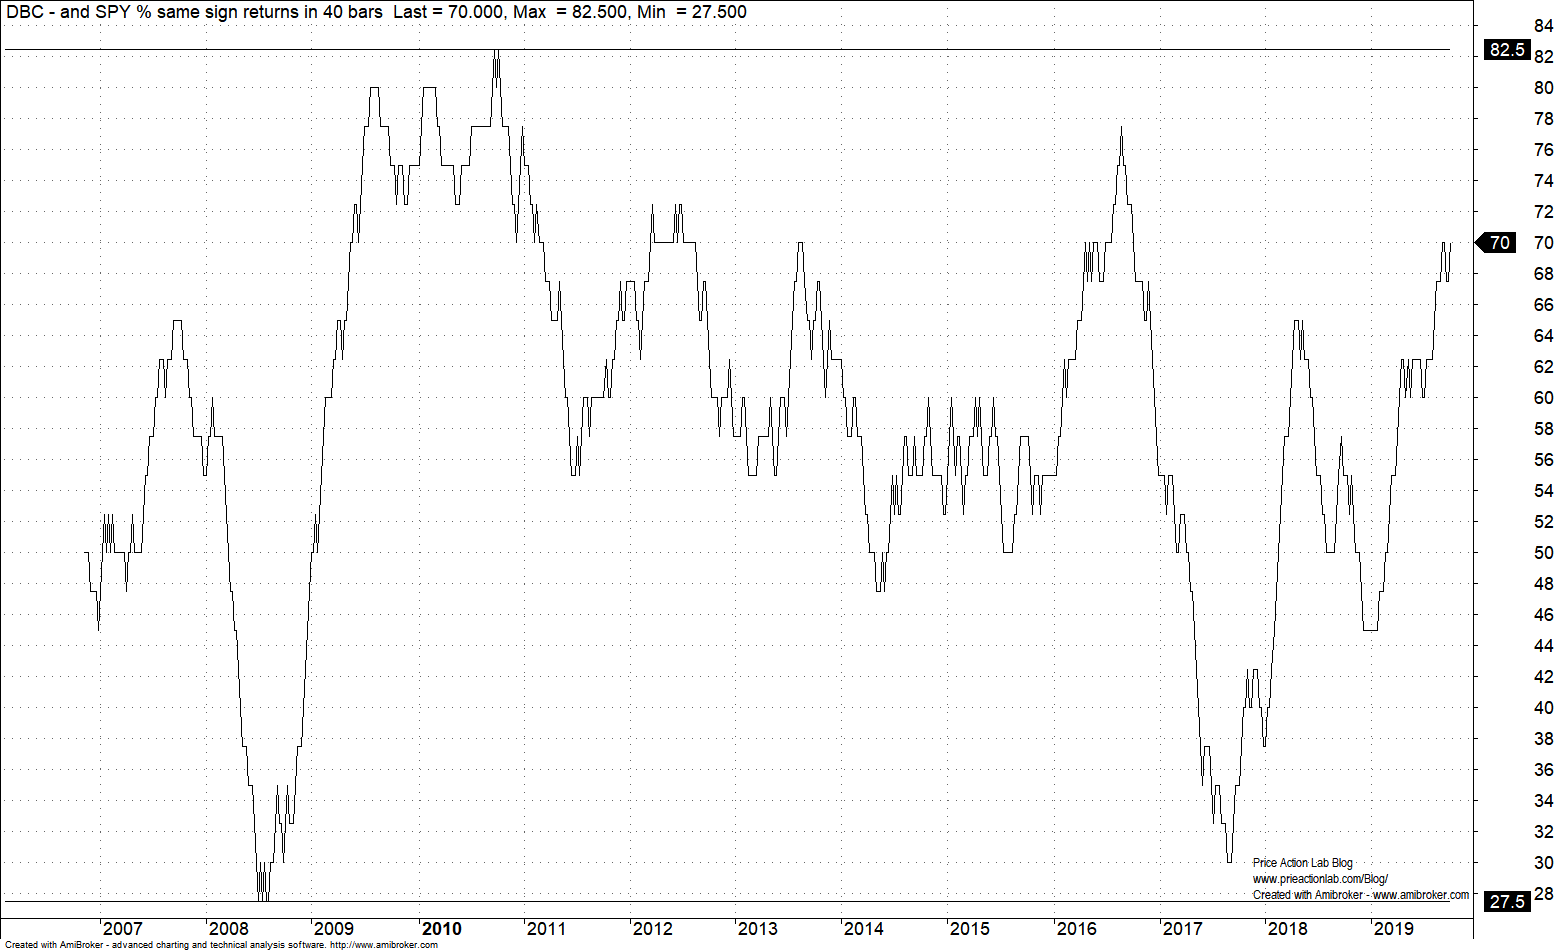
The weekly chart shows high variability and a minimum at 27.5% in 2008 and gain close to that at 30% in 2018. This chart also does not provide an indication of a sustainable trend.
Conclusion
At times equity markets and commodities returns in daily and weekly timeframes couple but during other times they decouple. There does not seem to be a sustainable and persistent effect due to financialization in this respect.
If you found this article interesting, I invite you follow this blog via any of the methods below.
Subscribe via RSS or Email, or follow us on Twitter
If you have any questions or comments, happy to connect on Twitter: @mikeharrisNY
Charting and backtesting program: Amibroker
Technical and quantitative analysis of major stock indexes and 34 popular ETFs are included in our Weekly Premium Report. Market signals for position traders are offered by our premium Market Signals service


