


Survivorship bias increases as a function of the number of constituents in an index and length of backtest. Backtests of momentum rotational trading strategies using indexes with hundreds or thousands of stocks may generate misleading results even if they account for delisted securities depending on starting date.
There are many articles in blogs with impressive backtest results from strategies that exploit the momentum anomaly in the equity markets. But how realistic are these results? Obviously this is a complex issue and the aim of this article is to provide a few examples only as a basis for further research. I am sure others have already researched this problem.
At Price Action Lab Blog our equity strategies concentrate on Dow 30 index because backtests have minimum survivorship bias due to small number of constituents. As it turns out for most short-term strategies we focus on, the bias due to Dow 30 rebalancing reduces annualized return by about 200 basis points on the average. However, for indexes such as S&P 500 and Russell 2000, the bias can be 1000 basis points or even larger.
This is important: because someone has taken into account delistings it does not mean there is no survivorship bias. The bias may hide in time periods before the start of the backtest and the results may actually be misleading (Type I error.)
For the examples in this article we used Norgate data for S&P 500 index that also include current and past constituents. We highly recommend this data service (we do not have a referral arrangement with the company.)

Consider a momentum rotational trading strategy as follows:
Timeframe: Daily (adjusted data)
Index: S&P 500
Strategy score: Buy the 10 stocks with highest 252-day rate of change
Bear market filter: Close of S&P 500 greater than its 200-day moving average
Position size: 10%
Commission: $0.01/share
All trades are executed at the open of the next bar
Backtest range: 01/03/2007 – 11/15/2019
Below is the equity curve for S&P 500 index current constituents (no delistings taken into account.)
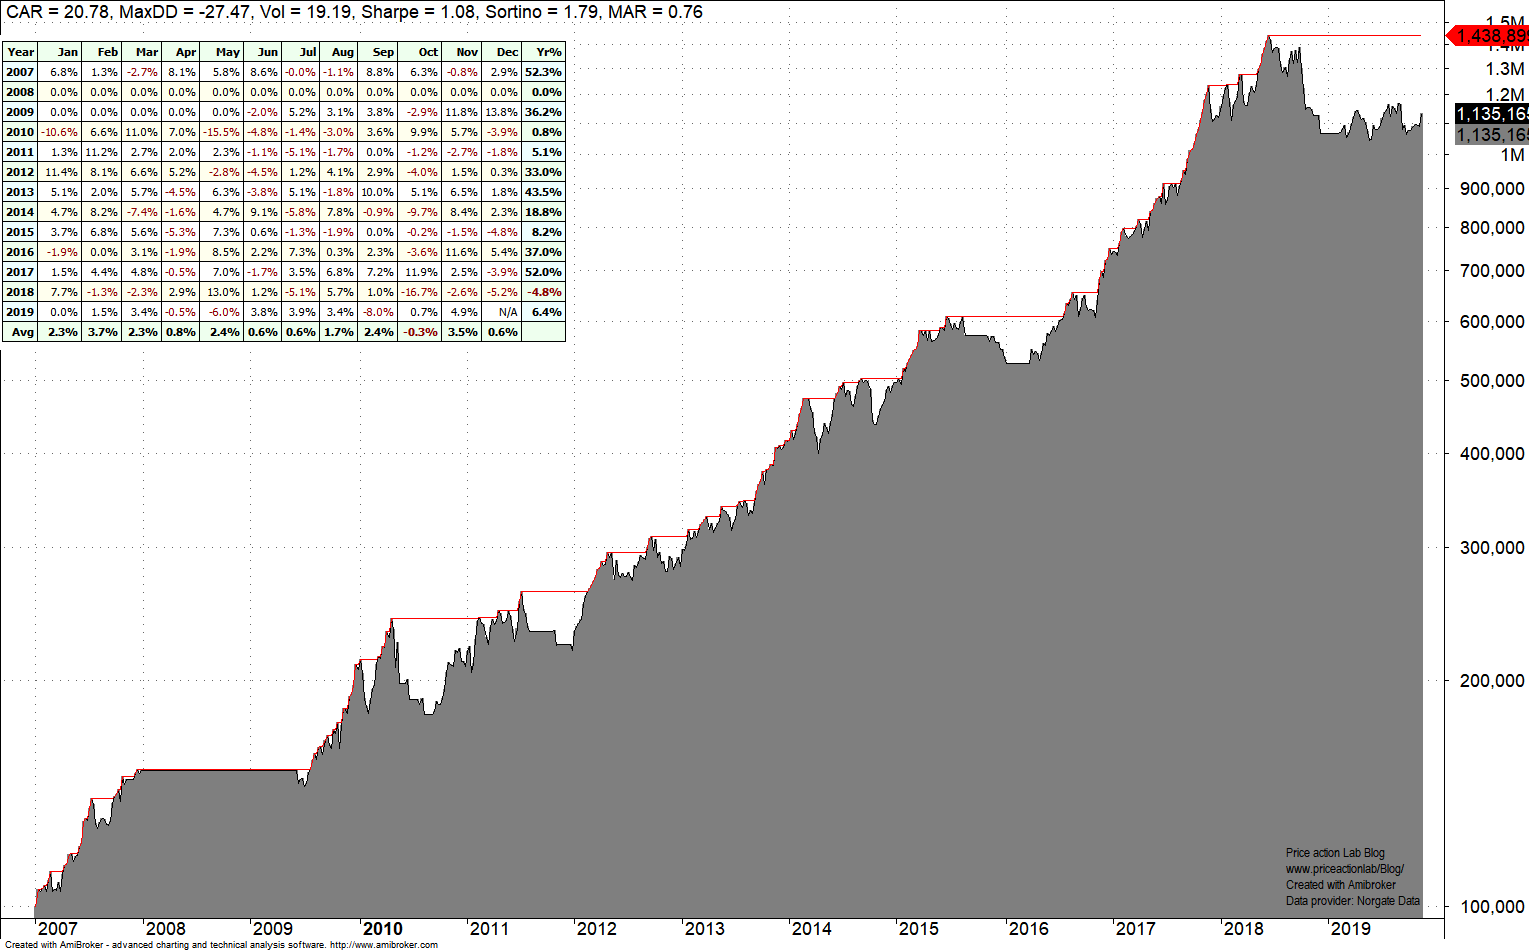
Despite the recent drawdown, this is an impressive backtest. However, this is also a meaningless backtest. Unfortunately, this is the kind of backtest seen in some blogs. CAGR is more than 20% and Sharpe is about 1 but these metrics are inflated by survivorship bias due to index constituent changes.
If we take into account index past and current constituents, this is how the results change.
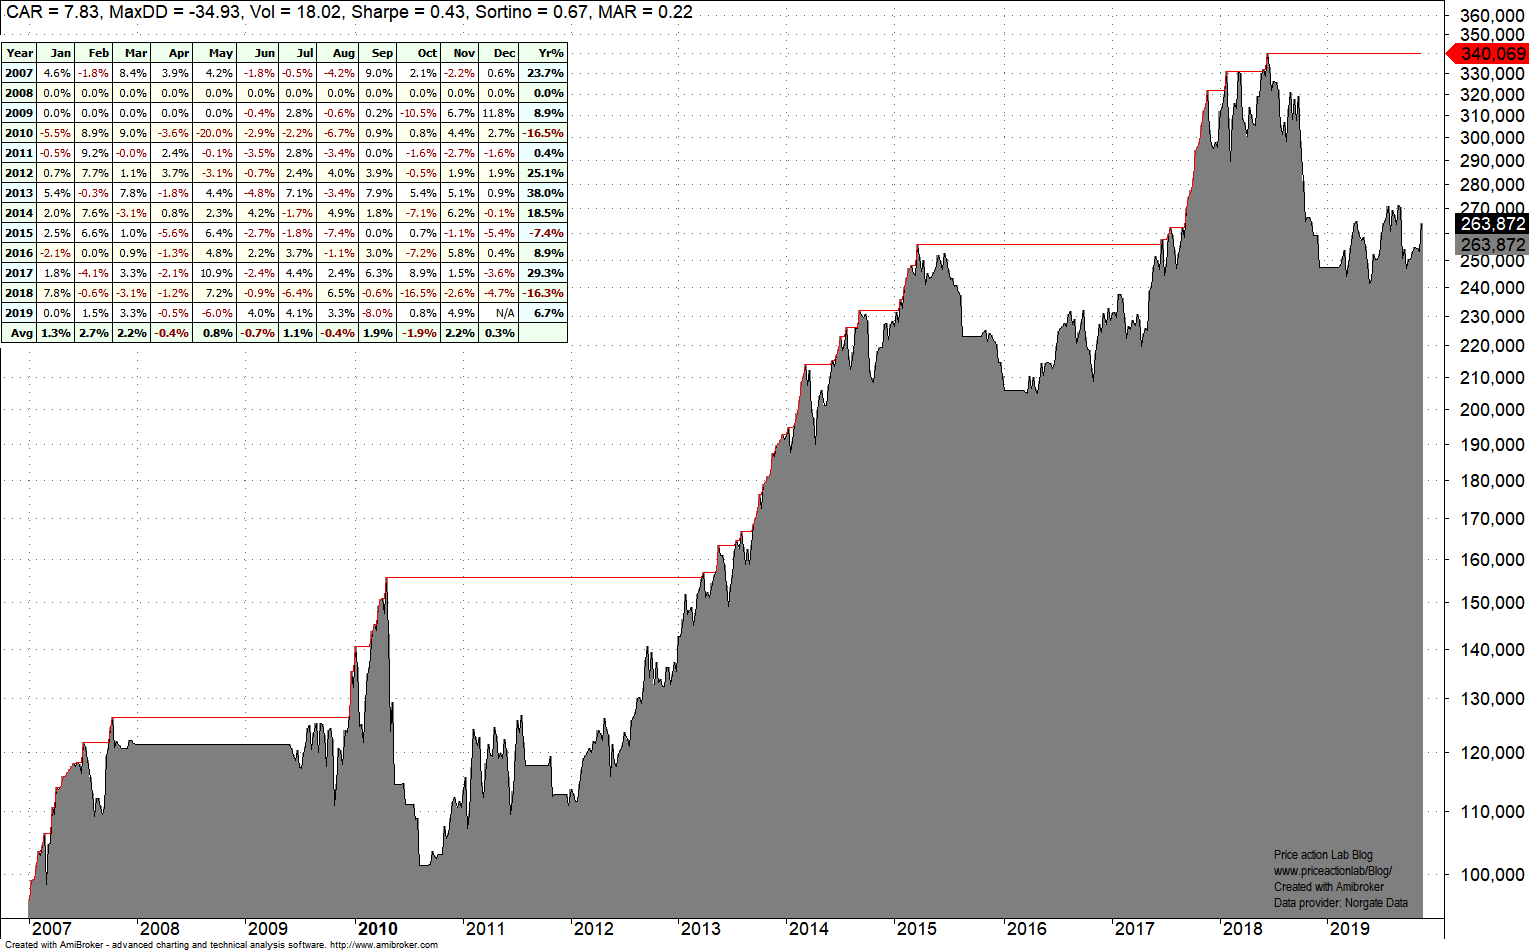
CAGR drops to less than 8% from more than 20%, maximum drawdown increases significantly and Sharpe is reduced by a factor of 2. This is a more realistic backtest of the momentum rotational strategy and what an experienced developer should expect. Usually, but not always, a high CAGR indicates some kind of bias including but not limited to survivorship, look-ahead or bias due to code errors.
This is also important: because a developer accounted for delisted securities that does not mean the problem was solved. There may be more problems hidden in the past. Below are the results that account for survivorship bias with backtest starting on 01/1995.

CAGR increases due to the 90s uptrend but there is a problem: maximum drawdown also increases to more than 50%. In essence then, the performance of this strategy is statistically indistinguishable from that of buying and holding the index total return. Momentum rotation is not free lunch if biases are taken into account.
Obviously, one could optimize the score lookback period and use more filters to smooth results but usually this introduces another form of bias: data-mining. There is a chance of getting away using a few tricks but in many cases the bias hides somewhere else.
Conclusion
Using indexes with hundreds or thousands of constituents increases possibilities but also bias due to rebalancing. Longer backtests accounting for constituent changes may provide realistic results. When that is done the impact of bias on results becomes apparent and most strategies do not outperform buy and hold.
Charting and backtesting program: Amibroker
Data provider: Norgate Data
Technical and quantitative analysis of major stock indexes and 34 popular ETFs are included in our Weekly Premium Reports. Market signals for position traders are offered by our premium Market Signals service
If you found this article interesting, you may follow this blog via RSS or Email, or in Twitter


