


Year-over-year NASDAQ -100 return is close to 40% and while some market analysts call it extraordinary, it is far from that, as the chart below shows.
When confronted with evidence that their claim is not sound, usually some analysts do not respond because their target audience is not those who understand markets but uninformed investors who get easily impressed by flashy websites and unverified credentials in social media profiles.
Claims about an imminent collapse of the economy or Fed’s role in inequality and creating a market bubble, are made daily and in such complex ways that most uninformed readers are compelled to believe them due to “complexity bias“, which is a known tendency for people to assign higher validity to complex theories when a simpler alternative provides the answer.
Among myriads of unsound claims in financial blogosphere and social media a recent one is that NASDAQ year-over-year return is extraordinary due to central bank intervention. However, as the chart below shows, these claims are false.
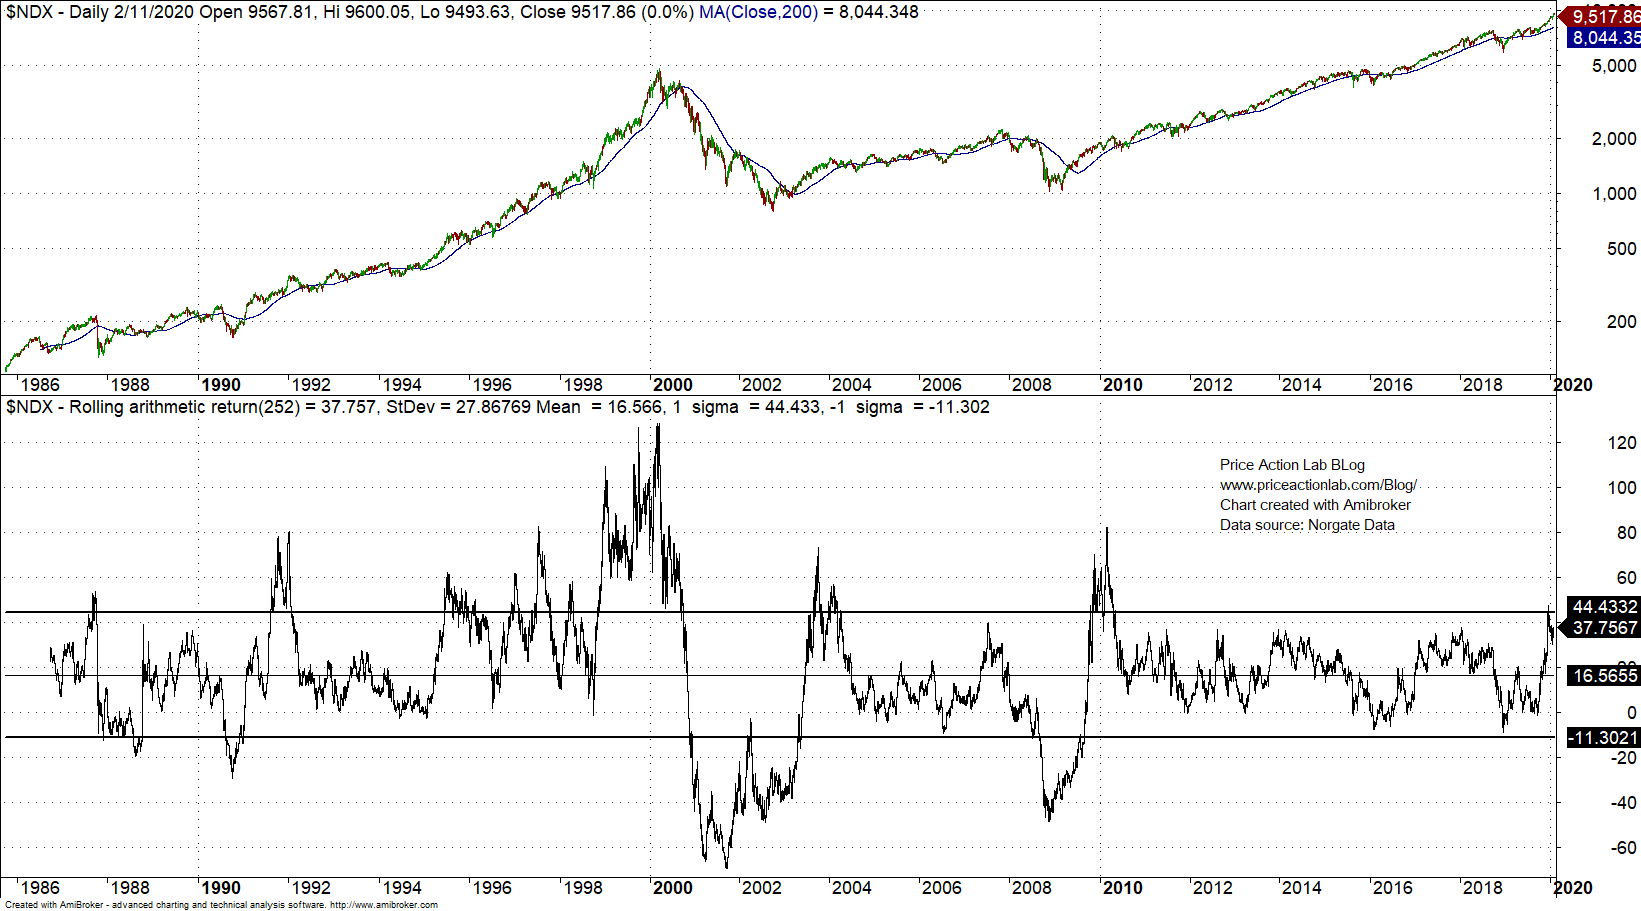
The above chart shows the rolling 252-day return of NASDAQ-100 since October 1985. The current return is 37.8% and that may sound high but it is less than one standard deviation of the sample at about 44%.
More importantly, the 252-day return was much higher in the past as shown in the table below.
| Calculation Date | YOY Return |
| 09/11/1987 | 52.8% |
| 01/14/1992 | 80.5% |
| 07/17/1995 | 62.5% |
| 01/13/1997 | 61.7% |
| 07/23/1997 | 80.5% |
| 04/01/1998 | 56.7% |
| 01/11/1999 | 101.2% |
| 10/08/1999 | 126.4% |
| 03/10/2000 | 128.4% |
| 10/09/2003 | 73.0% |
| 03/09/2010 | 82.1% |
As it may be seen from the above table, YoY returns after 2010 lag significantly those realized in the 90s. Some analysts point to high price and uninformed individuals get impressed by their claims but returns are only relevant to portfolio growth.
If the Fed is driving the markets as many analysts claim, it hasn’t been doing a good job judging from the market growth in the 90s. Markets need a good growth story that may be absent nowadays and returns, although high, they are nevertheless lower than those realized in past despite claims to the contrary.
Charting and backtesting program: Amibroker
Data provider: Norgate Data
Technical and quantitative analysis of major stock indexes and 34 popular ETFs are included in our Weekly Premium Reports. Market signals for position traders are offered by our premium Market Signals service
If you found this article interesting, you may follow this blog via RSS or Email, or in Twitter


