


Performance of weekly long/short strategy from January 2, 2020 to April 24, 2020.
The weekly dollar neutral long/short strategy trades long the top three and short the bottom three Dow-30 stocks in weekly timeframe with equal equity allocation. The stock selection is accomplished via a ranking function based on features generated by DLPAL LS software. Click here for more information and related articles.
In weekly timeframe there is no minimum holding period. The signals of this strategy are available in our weekly Market Signals reports.
Time-frame: Weekly
Strategy type: Long/short equity
Universe: Dow 30 stocks (except RTX and DOW)
Backtest period: 01/04/2016 – 04/24/2020
Weekly feature calculation period: 01/03/2000 – 12/31/2015
Open positions: Maximum 3 long and 3 short
Position size per stock: Equity/6
Position entry/exit: Open of next weekly bar
Commission per share: $0.005
Below is the equity curve of the strategy from 01/04/2016 to 04/24/2020 based on a backtest.

There was a setback in March of this year due to a long position in BA but strategy is recovering. The total return is about 31% and maximum drawdown is only 5.5% allowing use of leverage.
Below is the backtest for this year only.
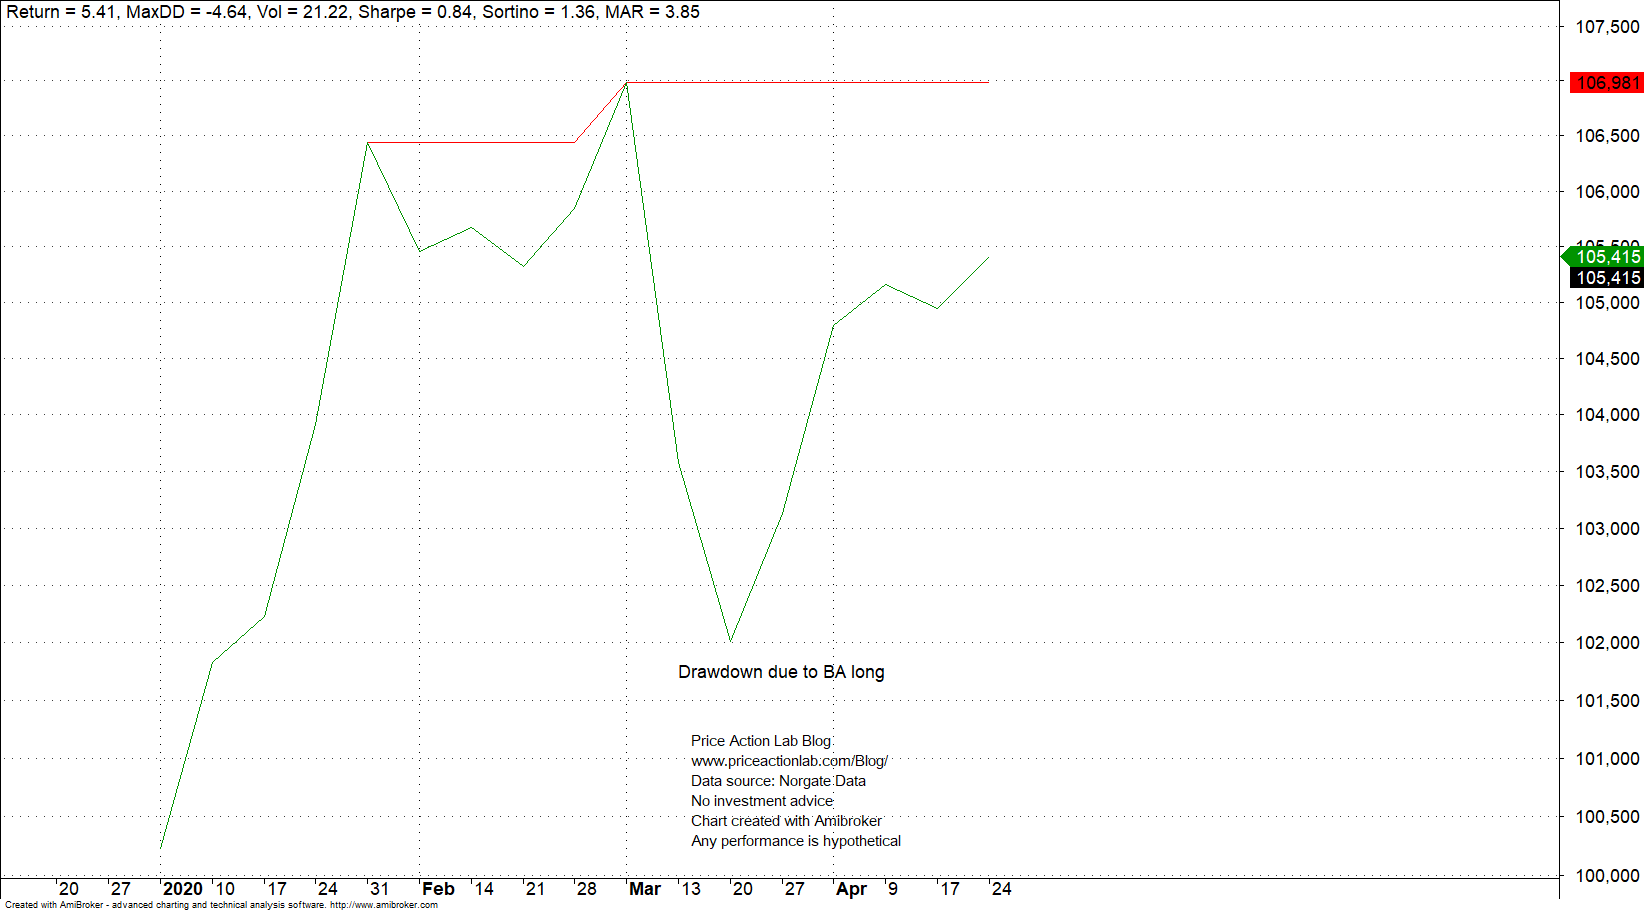
Total return is 5.4% at 4.6% maximum drawdown. The impact of the long BA position is more evident from this chart: return fell from about 7% to around 2% in March but the recovery has been steady since.
For more details about the strategy click here. More details about DLPAL LS can be found here. For more articles about DLPAL LS click here.
Strategy performance results are hypothetical. Please read the Disclaimer and Terms and Conditions.


