


Daily S&P 500 returns have a highly leptokurtic distribution, but annual returns are close to normal. What does this mean for traders and investors?
Below is the distribution of daily returns for the S&P 500 from 08/1940 to 04/09/2020.

This is a highly leptokurtic distribution with a kurtosis of 23.3866. The mean, standard deviation, and results of the Lilliefors normality test are shown below:
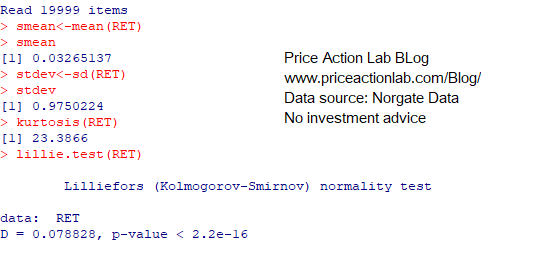
The mean daily return is 0.0327%, and the standard deviation is 0.975%. The p-value of the test is practically 0, and normality is rejected.
We skip weekly, monthly, and quarterly returns because the results for normality are the same, i.e., normality is rejected, and we go to annual returns next.
Access the full article with a Premium Articles or All-in-One subscription. By subscribing, you have immediate access to hundreds of articles.
|
This post is for paid subscribers
Already a subscriber? Sign in |
Charting and backtesting program: Amibroker Data provider: Norgate Data
If you found this article interesting, you may follow this blog via RSS or Email, or in Twitter


