


In 7 1/2 weeks the following two events occurred in the stock market: the S&P 500 index fell 34% from all-time closing highs and then rallied about 25%.
Below is the S&P 500 chart with drawdown levels from highest close:
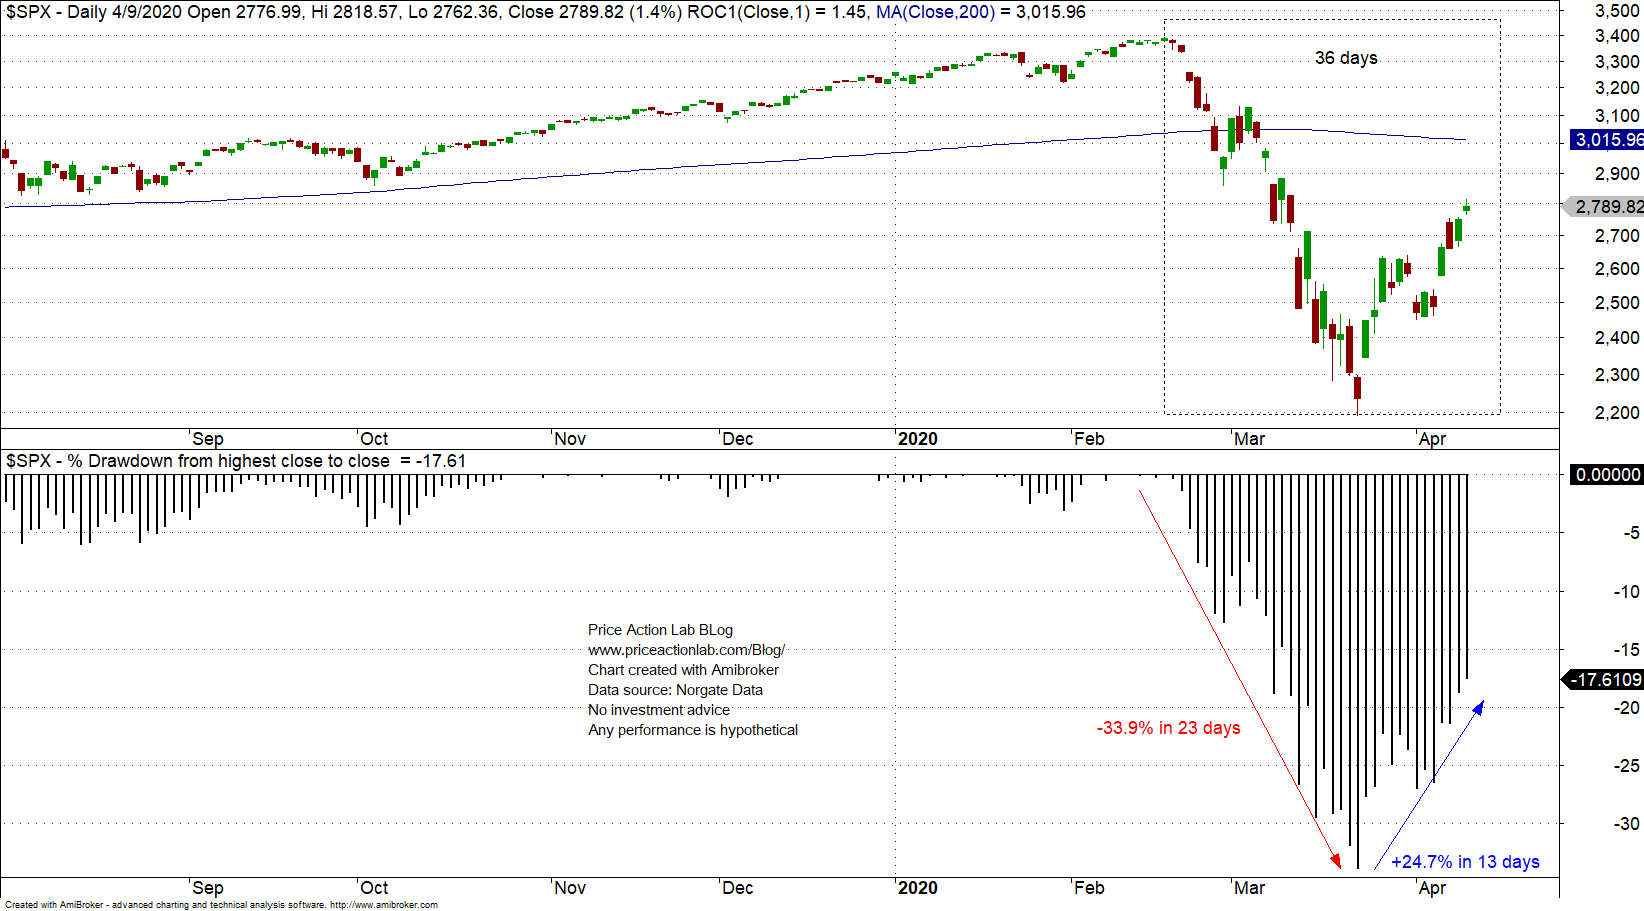
The table below summarizes S&P 500 index price action in last 36 trading days:
| Date | Price | Days | Drop from ATH |
| 02/19/2020 | 3386.15 | 0 | 0 |
| 03/23/2020 | 2237.4 | 23 | -33.9% |
| 04/09/2020 | 2789.82 | 36 | -17.6% (+24.7%) |
In 13 days from March 23 to April 9, the index surged 24.7% and the drawdown from all-time closing high was reduced to -17.6%. The index is now 13.6% in the red year-to-date.
The price action was unprecedented and concentrated in the tails of the returns distribution for most of the time as a result of extreme fear but also greed.
There are many traders who think this is an opportunity to make fortunes and many investors who think this is the end. In reality, the opposite many be true: this is a time when most traders lose money due to random high volatility and patient investors slowly accumulate cheap stocks that can generate high profits in the medium to longer-term. Caveat emptor: “this time may be different” and we do not know that, but unlikely.
In addition to the 7 1/2 week extreme swings, the S&P 500 had its second highest weekly gain this week since 1940.
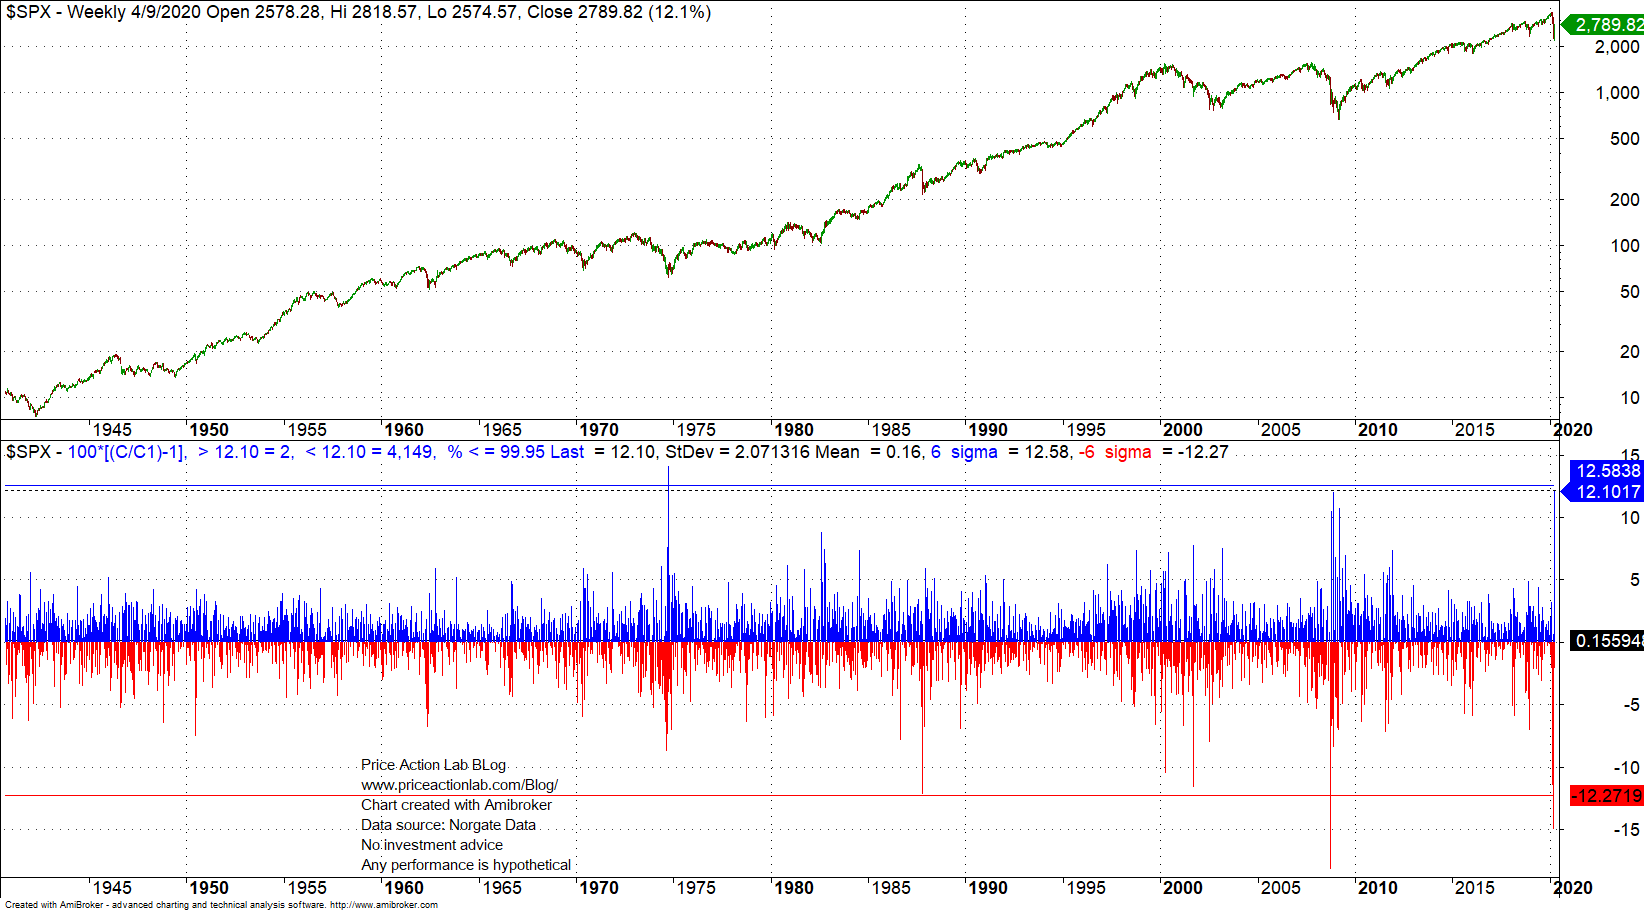
A 12.1% gain this week was just a little higher than the November 2008 gain at 12.03% and lower than a 14.12% gain in October 1974. Obviously, these comparisons may not be relevant considering the value of money and stock market capitalization.
Note that weekly moves above 12% are close to six standard deviations away from the sample mean (not population mean). These are extreme moves that may be more normal in the markets than assumed. Markets are dominated by human (algo) fear and greed and tail events must be expected.
Easter Sale! 10% off all premium subscriptions. Use discount coupon DC15. Expires April 12, 2020.

Price Action Lab Blog Premium Content
Charting and backtesting program: Amibroker
Data provider: Norgate Data
If you found this article interesting, you may follow this blog via RSS or Email, or in Twitter


