


Longer-term equity index charts offer the impression that passive investing in the stock market is a no lose proposition. This is true only if someone is lucky and can be very patient…
Is the chart of S&P 500 index below since 1945 an illusion as far as profiting from holding stocks longer-term?
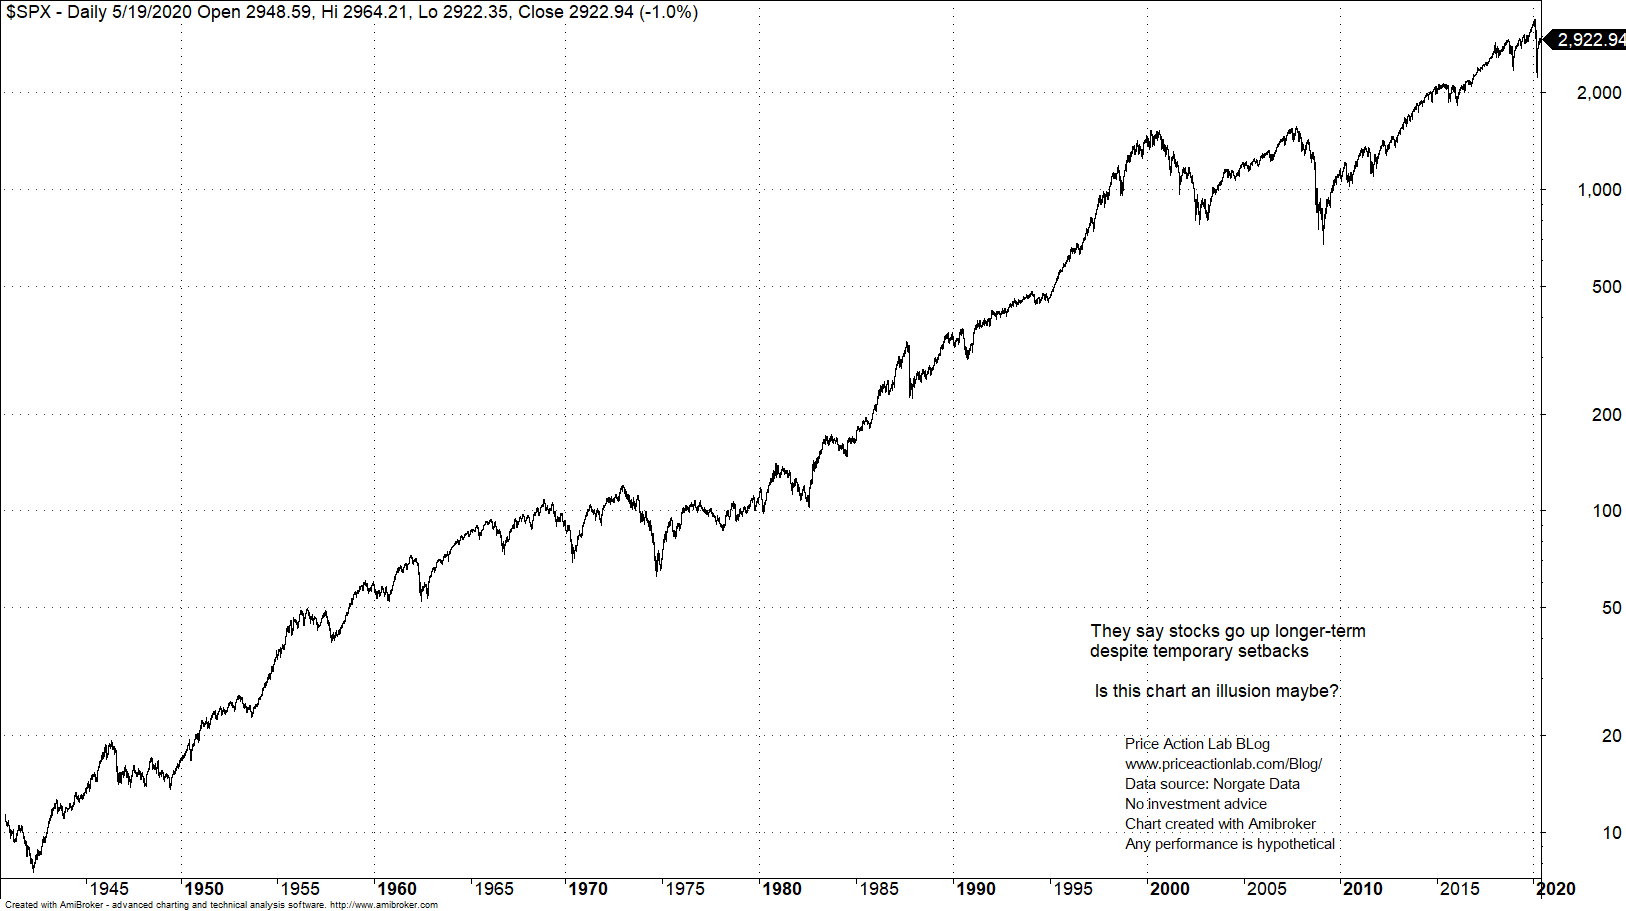
It depends on what we mean by “illusion” but in a sense it is. Profiting from holding stocks longer-term is not easy at all and on top luck is required.
With a few annotations below, what we mean may become clearer.
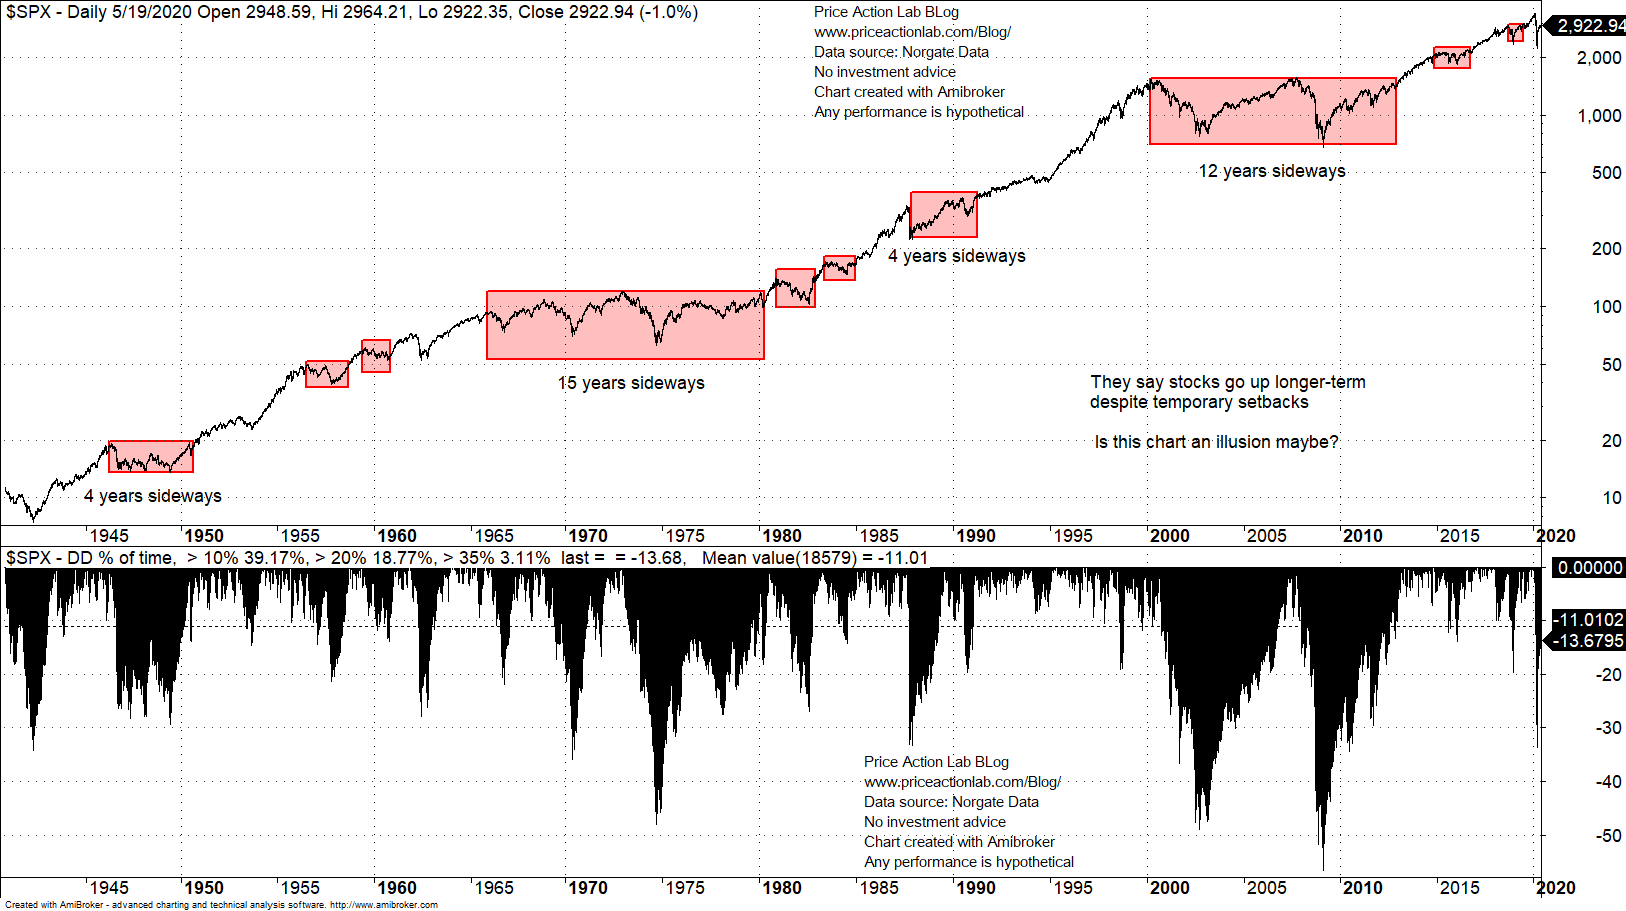
The pink rectangles show periods of time when stocks moved sideways. There are long periods of time of 15 and 12 years and several other shorter periods of time ranging from four to two years when stocks moved sideways
As the chart shows, the average drawdown from all-time highs since 1945 is 11%. About 18.8% of the time, the index was in greater than 20% drawdown, i.e., in a bear market and that is roughly a fifth of the chart length.
The biggest boost to stocks came from the 90s uptrend. Then, after two massive bear markets with drawdown in excess of 50%, the central bank decided to intervene to support equity markets.
For those who invested in the 60s or before the dot com bear market, the ride was rough; stock picking was the only way to make money, index buying and holding was a losing proposition. Luck plays an important role. The chart is an illusion.
Charting and backtesting program: Amibroker
Data provider: Norgate Data
If you found this article interesting, you may follow this blog via RSS or Email, or in Twitter

Price Action Lab Blog Premium Content


