


The stock of Boeing Co rose 41% on the week after rising 71% on week ending March 27, 2020. Those are 8 and 15-sigma events based on the weekly returns sample since 1950.
Below is the chart with weekly returns and the 8 and 15-sigma bands.
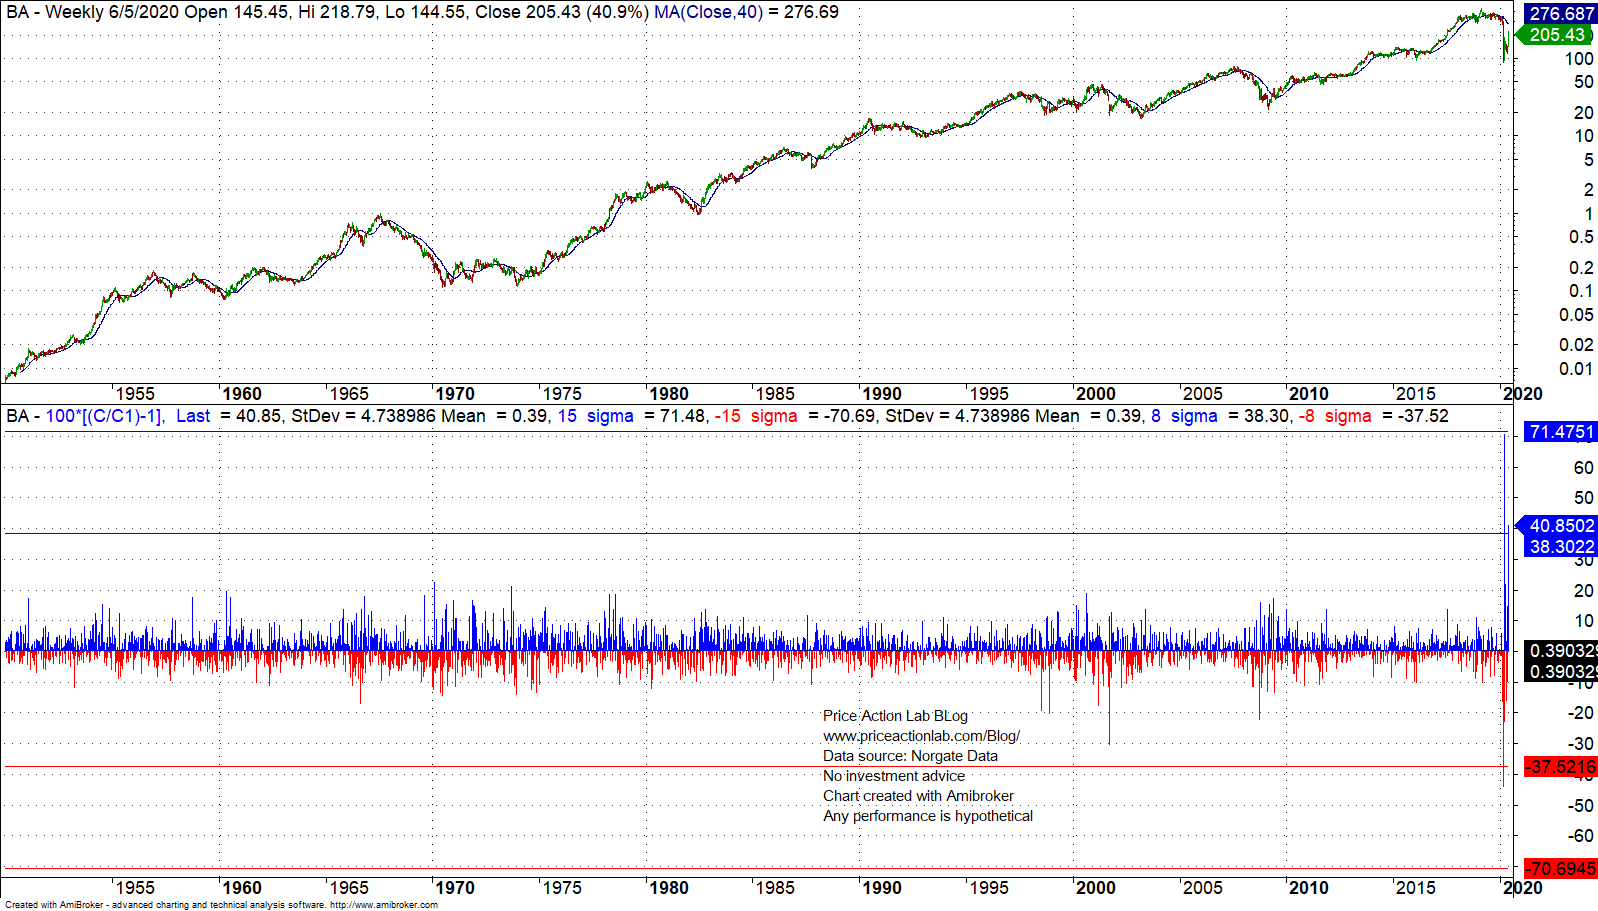
In week ending March 27 the stock rose 70.5%, or a 15-sigma event based on the weekly sample since 1950. Last week the stock rose 40.9% for an 8-sigma event based on same sample.
Note that any reference to “sigma” is for descriptive purposes only based on available sample. No inferences are made since the distribution sigma is not known.
These extreme weekly changes show the elevated risks in the stock market for shorts but also for longs. In this particular case, numerous retail accounts betting on the collapse of BA with out-of-the-money puts were probably wiped out completely.
A few months ago, even before the pandemic, there were hundreds of posts daily in social media about the pending collapse of the company. Not being able to confront some of those on a rational level I was forced to mute them to reduce the noise level. Any trader with experience knows that when the trade is crowded, there is no profit potential. At least, if you are going to buy BA puts, keep quiet. Apparently, either they do not understand trading or they have a different agenda.; it is irrelevant as they were BAed.
The chart of the week included in our weekly stock market technicals report shows that BA has gained 116% from the bottom of March 23, 2020. The stock is down about 52% from the all-time highs.
Charting and backtesting program: Amibroker
Data provider: Norgate Data
If you found this article interesting, you may follow this blog via push notifications, RSS or Email, or in Twitter

Price Action Lab Blog Premium Content


