


Backtest results for a strategy based on Gambler’s fallacy in the weekly timeframe trading stocks in S&P 1500 composite index with delistings taken into account. Access to full article requires Premium Insights subscription.
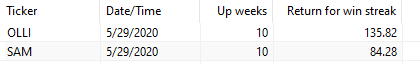
A scan of S&P 1500 constituents as of the close of Friday, May 29, 2020, in the weekly timeframe, yielded two stocks up 10 weeks in a row, SAM and OLLI, as shown below.
This is the chart for SAM.
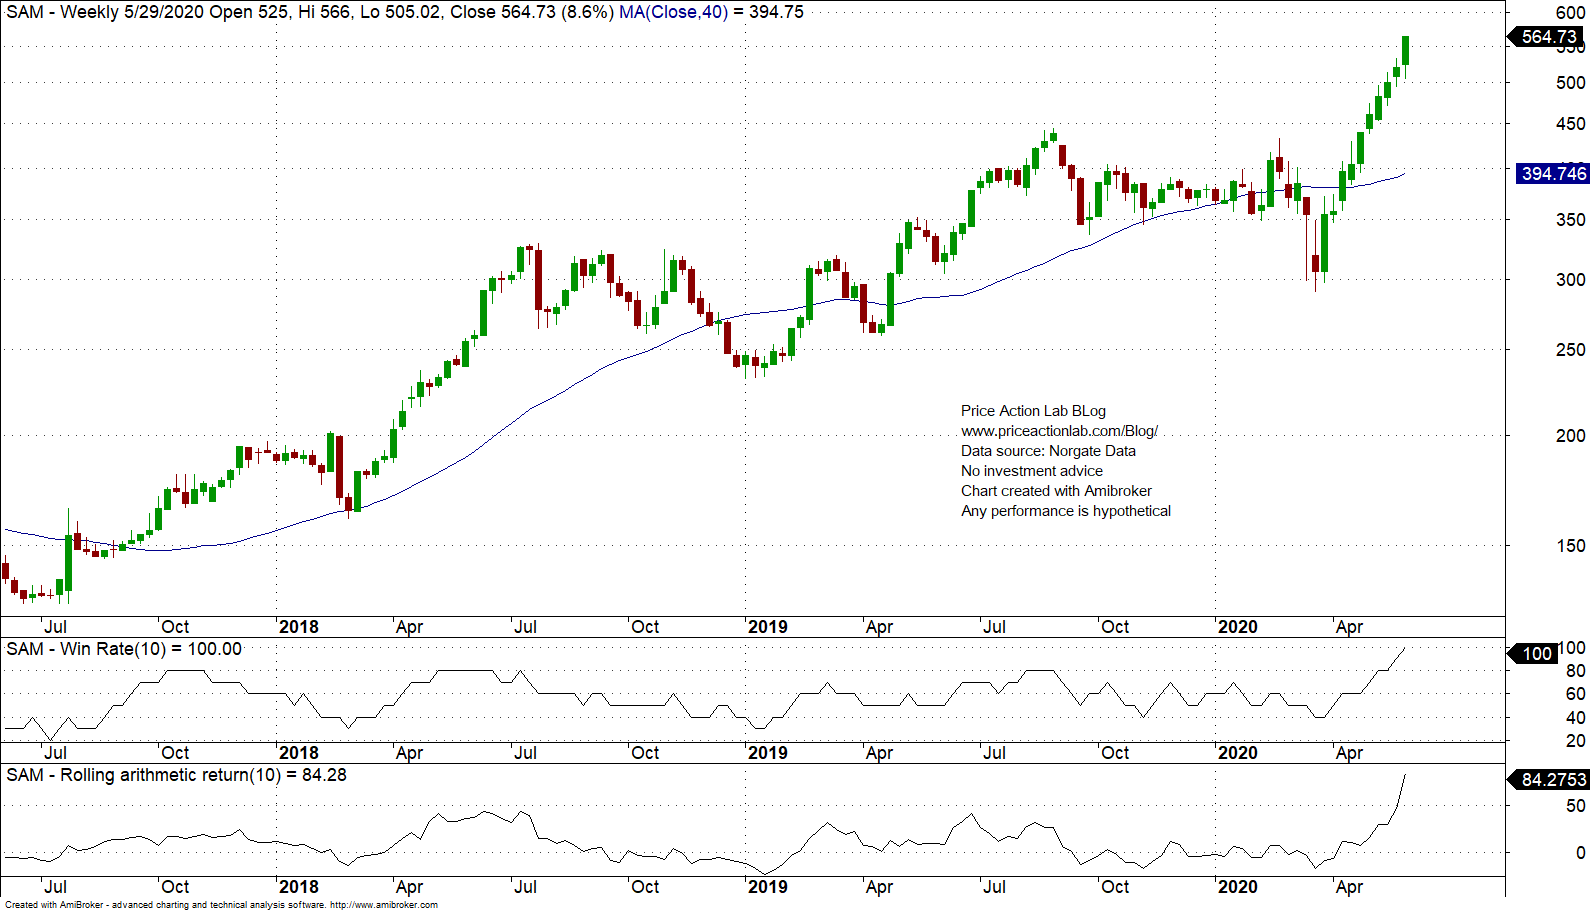
The Gambler’s Fallacy applied in this case is the belief that since a 10-week win streak is unusually long, there is high probability of a reversal the following week.
In this article we backtest a strategy that shorts stocks in the S&P 1500 universe if there is a 10-week win streak. The short positions are held for a number of weeks. We also compare to the reverse of buying the stocks after a 10-week win streak.
For the backtests in this article we used Norgate data for the S&P 1500 composite index that also include current and past constituents to remove survivorship bias. In the backtest the strategy traded the stocks that were part of the index at the time the win streak was formed.

A maximum of 10 open positions are held at any given time. If there were more signals, the stocks with the highest unadjusted price were selected.
Portfolio backtest settings
Strategy: Gambler’s Fallacy
Time-frame: Weekly (adjusted data)
Universe: S&P 1500 composite index
Backtest period: 01/03/2000 – 05/29/2020
Maximum open positions: 10
Commission per share: none
Position size per stock: Available equity/10
Trade holding period: 1, 2 or 5 weeks
Trade entry and exit: Open of next bar (no look-ahead bias)
The results are interesting and in some cases counter-intuitive. Below are the backtest results.
Case 1. Short positions – hold for one week.
|
This post is for paid subscribers
Already a subscriber? Sign in |
Specific disclaimer: This report includes charts that may reference price target levels determined by technical and/or quantitative analysis. No updates to charts will be provided if market condition changes occur that affect the levels on the charts and/or any analysis based on them. All charts and analysis in this report are for informational purposes only. See the disclaimer for more information.
Disclaimer: No part of the analysis in this blog constitutes a trade recommendation. The past performance of any trading system or methodology is not necessarily indicative of future results. Read the full disclaimer here.
Copyright notice: Any unauthorized copy, reproduction, distribution, publication, display, modification, or transmission of any part of this report is strictly prohibited without prior written permission.