

Historical backtests of two volatility strategies, year-to-date results and risk profiles. The logic of the strategies is included. Access to full article requires Premium Insights subscription.
No commission is included in the backtests below but the impact of $0.01/share is about 100 basis points off CAGR.
The first strategy trades ZIV inverse VIX volatility ETN. The strategy switches from long to short based on the formula included at the end of this article. These are the backtest results from 01/03/2012 to 06/17/2020.
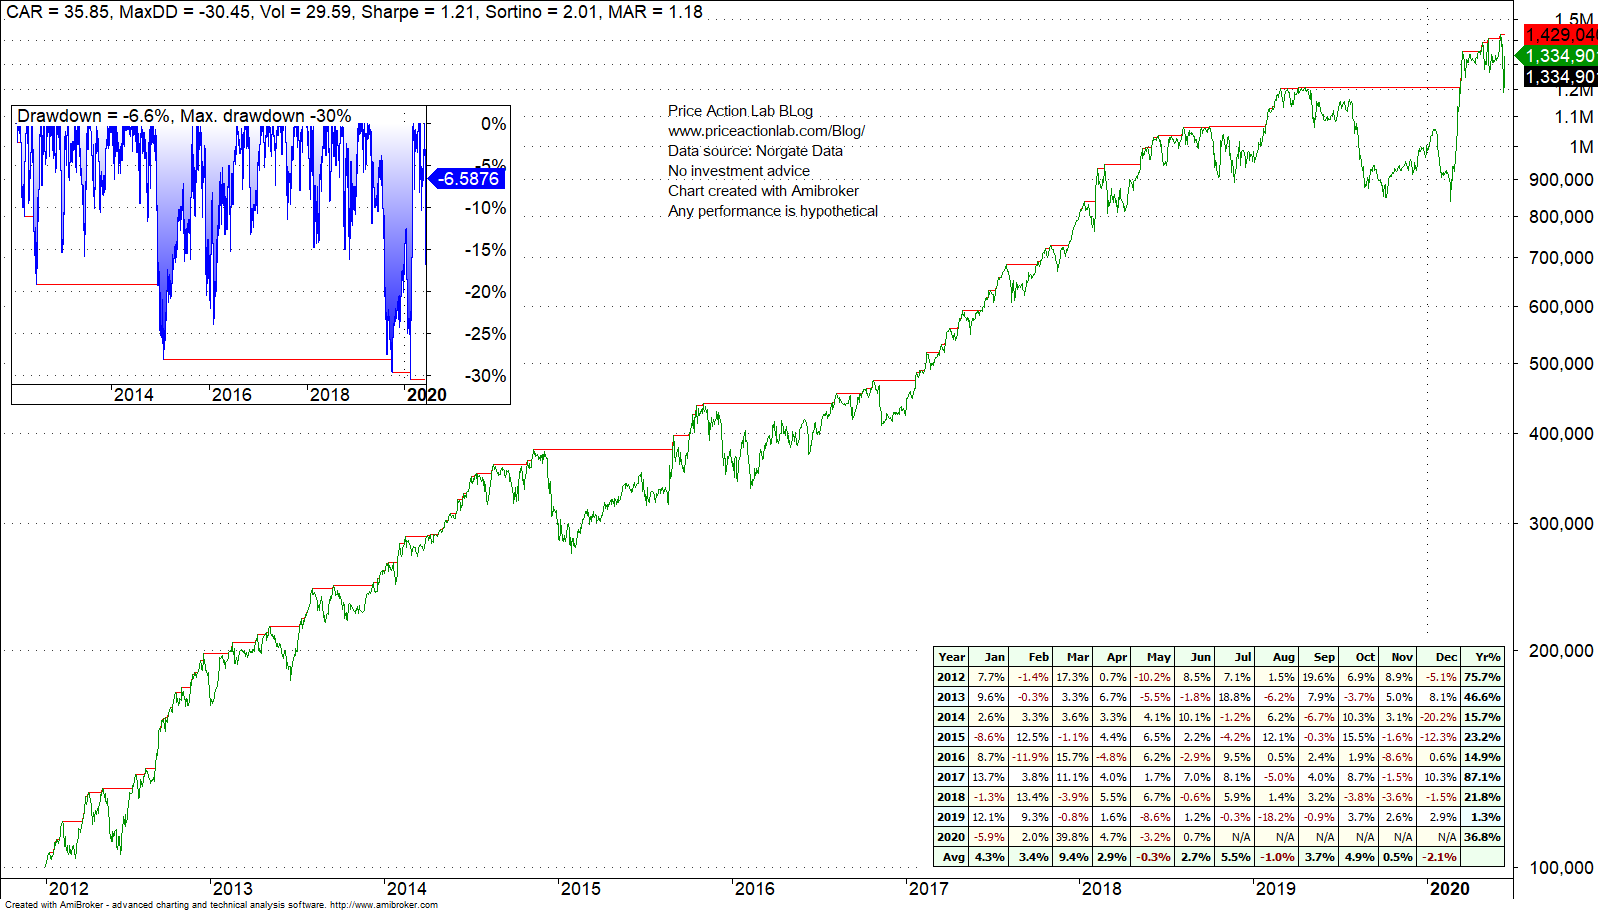
CAGR is a respectable 35.9% since 2012 with no loosing years. Year-to-date the strategy is gaining about 37%. However, since 2012 there have been several instances of drawdown larger than 25% and as large as 30%. This is a good strategy only for those that can withstand large drawdown in exchange for (potential) high rewards.
The second strategy trades TVIX 2x VIX volatility ETN. The strategy switches from long to short based on the formula included at the end of this article. These are the backtest results from 01/03/2012 to 06/17/2020.
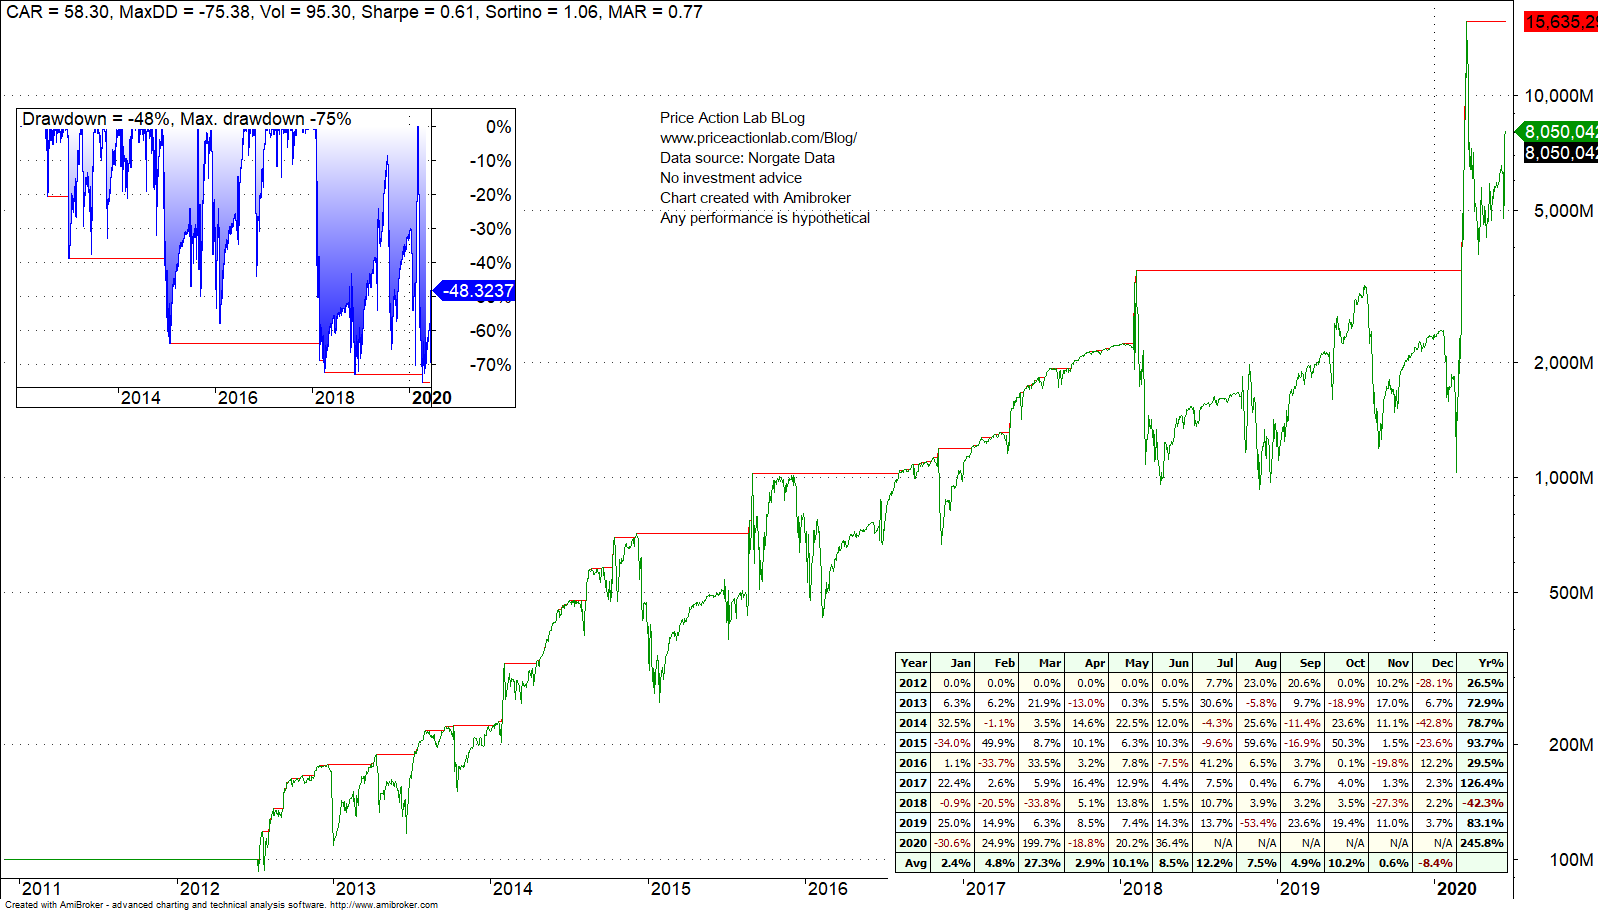
CAGR is more than 58.3% (originally CAGR reported with 4x leverage – now this error is fixed) with one losing year (2018.) Year-to-date the strategy is gaining about 246%! However, since 2012 there have been several instances of drawdown larger than 60% and as large as 75%. This is not a good strategy despite the huge annualized return in hindsight; uncle point has been hit several times (we define uncle point as any drop of equity more than 60%.) This is also an indication how these leveraged ETNs can drive traders to ruin despite large returns in backtests.
This is the logic of the strategies that volatility traders are familiar with.
|
This post is for paid subscribers
Already a subscriber? Sign in |
Volatility strategies using ETNs have high return potential but also carry high risks. These strategies are for experienced traders who know how to manage risk well.
Specific disclaimer: This report includes charts that may reference price target levels determined by technical and/or quantitative analysis. No updates to charts will be provided if market condition changes occur that affect the levels on the charts and/or any analysis based on them. All charts and analysis in this report are for informational purposes only. See the disclaimer for more information.
Disclaimer: No part of the analysis in this blog constitutes a trade recommendation. The past performance of any trading system or methodology is not necessarily indicative of future results. Read the full disclaimer here.
Copyright notice: Any unauthorized copy, reproduction, distribution, publication, display, modification, or transmission of any part of this report is strictly prohibited without prior written permission.