


This article includes an analysis of the performance of the equity long/short signals offered by this blog on a subscription basis for education purposes only in the period March 3, 2020 to December 24, 2020. The analysis includes performance metrics, regime shifts and comparison to S&P buy and hold performance.
The particular equity long/short signals this article deals with attempted to generate alpha by holding long and short positions from the open of a day to the close. Therefore, no positions were held overnight. This is an ambitious strategy because of the “overnight affect” and the fact that historically in the case of SPY ETF, regular trading hours have had minimum or no contribution to buy and hold performance.
The daily signals consisted of 5 long and 5 short positions from the S&P 500 universe generated by DLPAL LS software after the close of a day. Subscribers would access this blog for the daily updates. The performance shown below is not a backtest in the usual sense but it is based on the returns of the actual signals posted for subscribers. The performance calculations assume equal allocation in the 10 stocks. There is no commission and slippage included and more on that later.
Performance summary (March 5, 2020 to December 24, 2020)
| Long/Short Strategy | S&P 500 | |
| Since March 5, 2020 | +19.5% | +18.3% |
| Max. drawdown | -6.9% | -28.6% |
| Sharpe | 1.67 | 0.74 |
| Mean return | +0.090% | +0.107% |
| Standard deviation | 0.854% | 2.293% |
| Kurtosis | 15.8 | 10.5 |
| Skewness | +1.98 | -0.59 |
| Minimum daily return | -2.7% | -12.0% |
| Maximum daily return | +6.2% | +9.4% |
Sharpe of the strategy is 1.67 versus 0.74 for S&P 500 buy and hold. Skewness of the distribution of returns was +1.98 versus -0.59 for buy and hold. Both distributions have high kurtosis.
Equity curve with performance periods ( A – G)
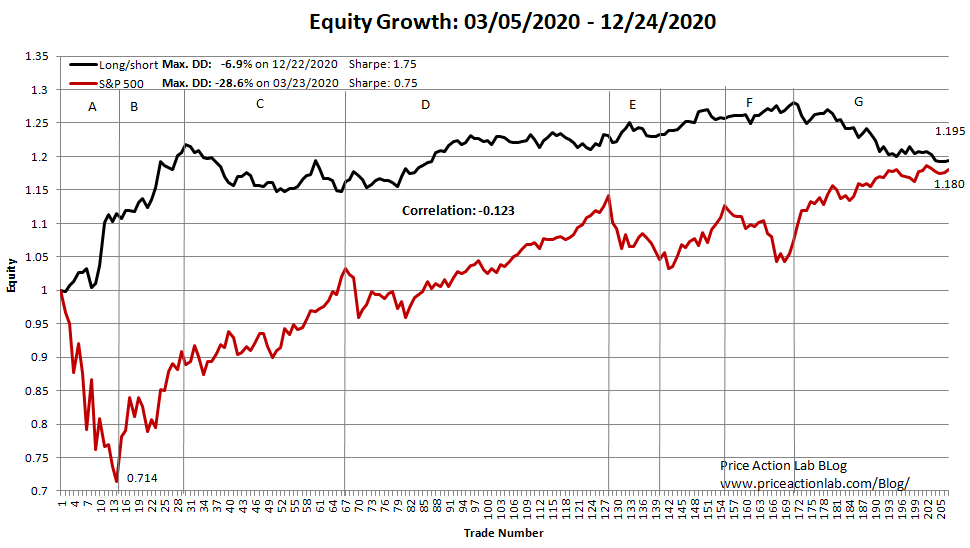
Analysis of performance periods
We started the long/short equity signals on March 5, 2020, after the stock market made a top on February 20, 2020. The objective was to see if these signals could provide convexity when compared to S&P 500 but without exposing the strategy to overnight risk. In the initial period A, convexity was achieved: the strategy gained about 10% in this period as compared to a loss of about -28.6% for the S&P 500. In period B, both the strategy and S&P 500 had significant gains. Then, in period C, there was a slight regime shift and the strategy lost about 5% while the S&P 500 gained more than 12%.
However, during period D both the strategy and S&P 500 gained, about 10% and 12%, respectively. In the next period, E through F, volatility returned to the market and there was consolidation in S&P 500 but long/short continued to gain and performance peaked on November 4, 2020, with a return of about 28% before commissions and slippage.
Afterwards, there was a significant regime shift in period G we are still analyzing and try to understand its impact on long/short in general and how to avoid such periods in the future. Specifically, the S&P 500 gained about 13% during this period while the strategy lost about 7% to end the year (December 24, 2020) with a return of a little less than 20%.
One of the predominant factors for the negative performance divergence of the strategy from S&P 500 performance in the last period (G) was that oversold and beaten stocks in the S&P 500 started rebounding. As a result, the short leg of the strategy started experiencing losses that the long leg could not cover. In addition there was significant volatility drag in the returns in this last period.
As a conclusion of this limited and brief analysis, if one can device a regime shift indicator to detect significant anomalies in the price action of oversold stocks, then that may serve as a useful indicator for reducing exposure of equity long/short strategies, or even pausing execution.
For more details, a histogram of daily returns and example of signals output click here.
Note that for generating just the signals for this and related strategies, the reduced functionality version of DLPAL LS software is sufficient. For advance analysis including historical feature generation for backtests, the professional version is required.
Commission and slippage impact on returns
Actual performance will vary due to slippage, commission and other known or unknown factors that may affect trading performance. Also, during times of high volatility, shorting particular stocks may not be possible due to lack of inventory and the strategy should be adjusted accordingly to remain dollar neutral if that is desirable. In general, performance after commission and slippage depends on execution efficiency of broker liquidity search algorithms and falls beyond the scope of this analysis. We expect an impact of -20% to -25% on performance due to execution cost but it may even get higher to even -50% in cases on inefficient executions and especially those that involve trades placed at the open (MOO) and at the close (MOC).
Disclaimer: The author of this website is not a registered financial adviser. Before subscribing read our full Disclaimer and Terms and Conditions.


