


Despite a GDP fall of 9.2% in the second quarter of this year with a simultaneous jump in unemployment of 14.7%, the S&P 500 has gained 65.3% from the lows of March. How can this be possible?
To start with, this large return is possible because it has already occurred. More about the reasons we believe this extraordinary return occurred after the chart below.
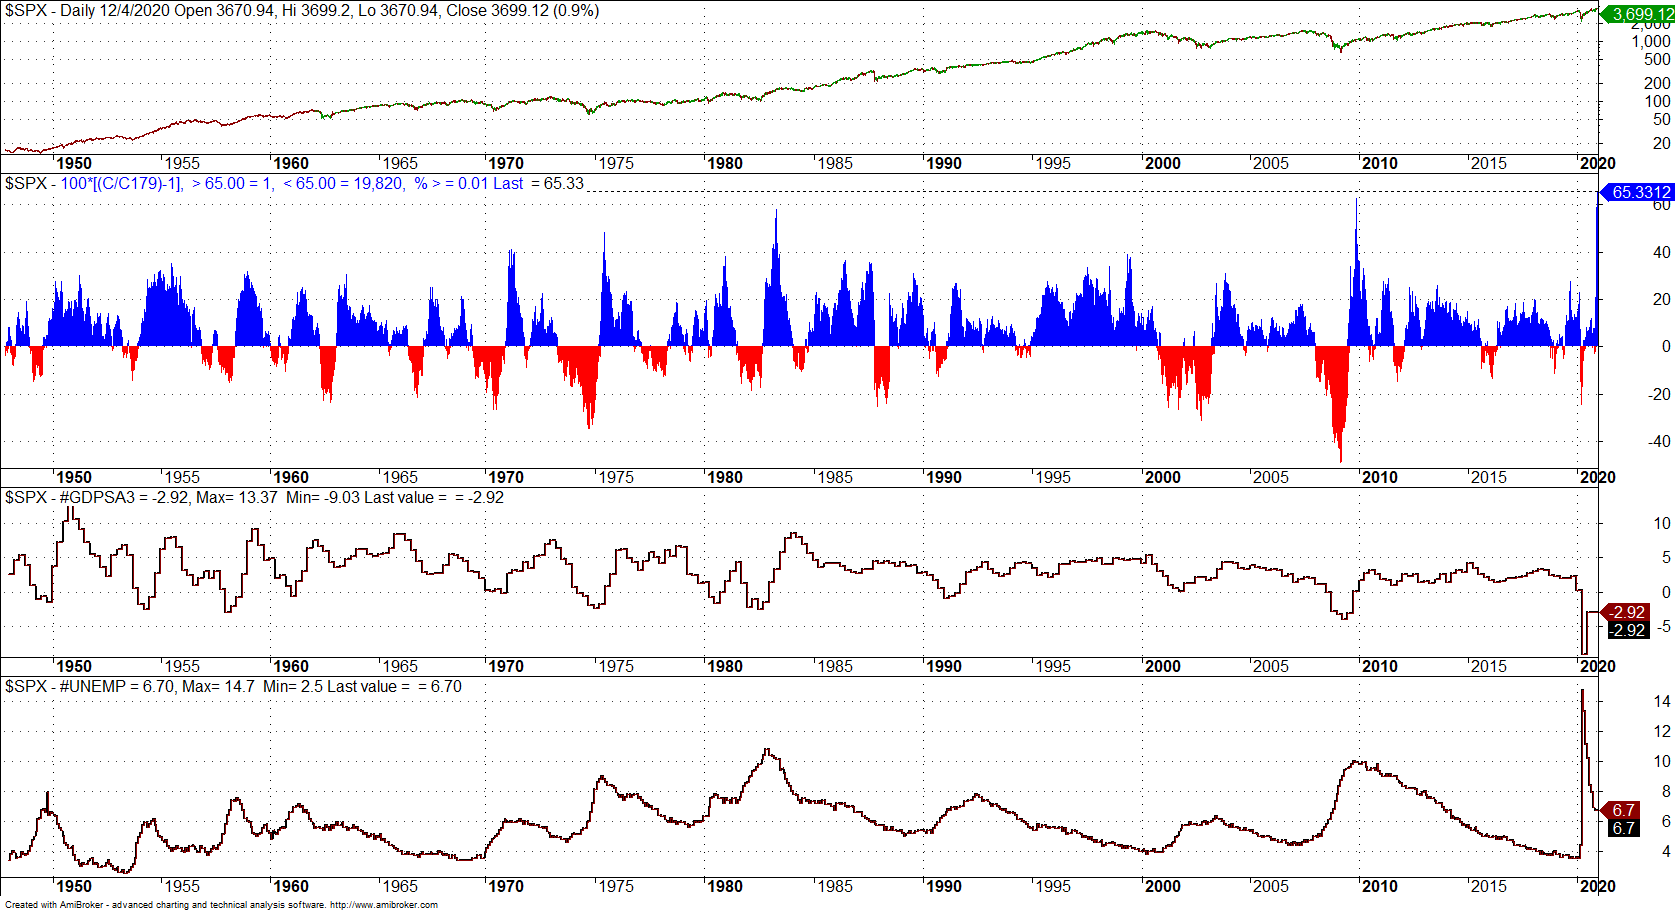
The above chart shows that the 179-day return from the low of March of this year to December 4 is the largest since at least 1947. At the same time, GDP dropped 9.2% in the second quarter from previous quarter and unemployment rate spiked to 14.7%.
How can this be possible? Isn’t the stock market a reflection of the state of the economy?
It used to be. There was a regime change in 2009 when central banks started quantitative easing and indirect but also direct in some cases intervention to support equity prices.
Nowadays, the stock market is not a reflection of the state of the economy but of the state of equity market speculators.
This is the answer to the question.
Charting and backtesting program: Amibroker
Data provider: Norgate Data
If you found this article interesting, you may follow this blog via push notifications, RSS or Email, or in Twitter

Price Action Lab Blog Premium Content


