


The S&P 500 is up the most in February of this year so far since February 1998. Although February has been a flat month historically based on data since 1941, in the last 12 years of quantitative easing the average return is about 1.7%.
The average return for the month of February since 2010 would have been even larger had it not been affected by last year’s market crash and a fall of 8.4%, as shown in the chart below.
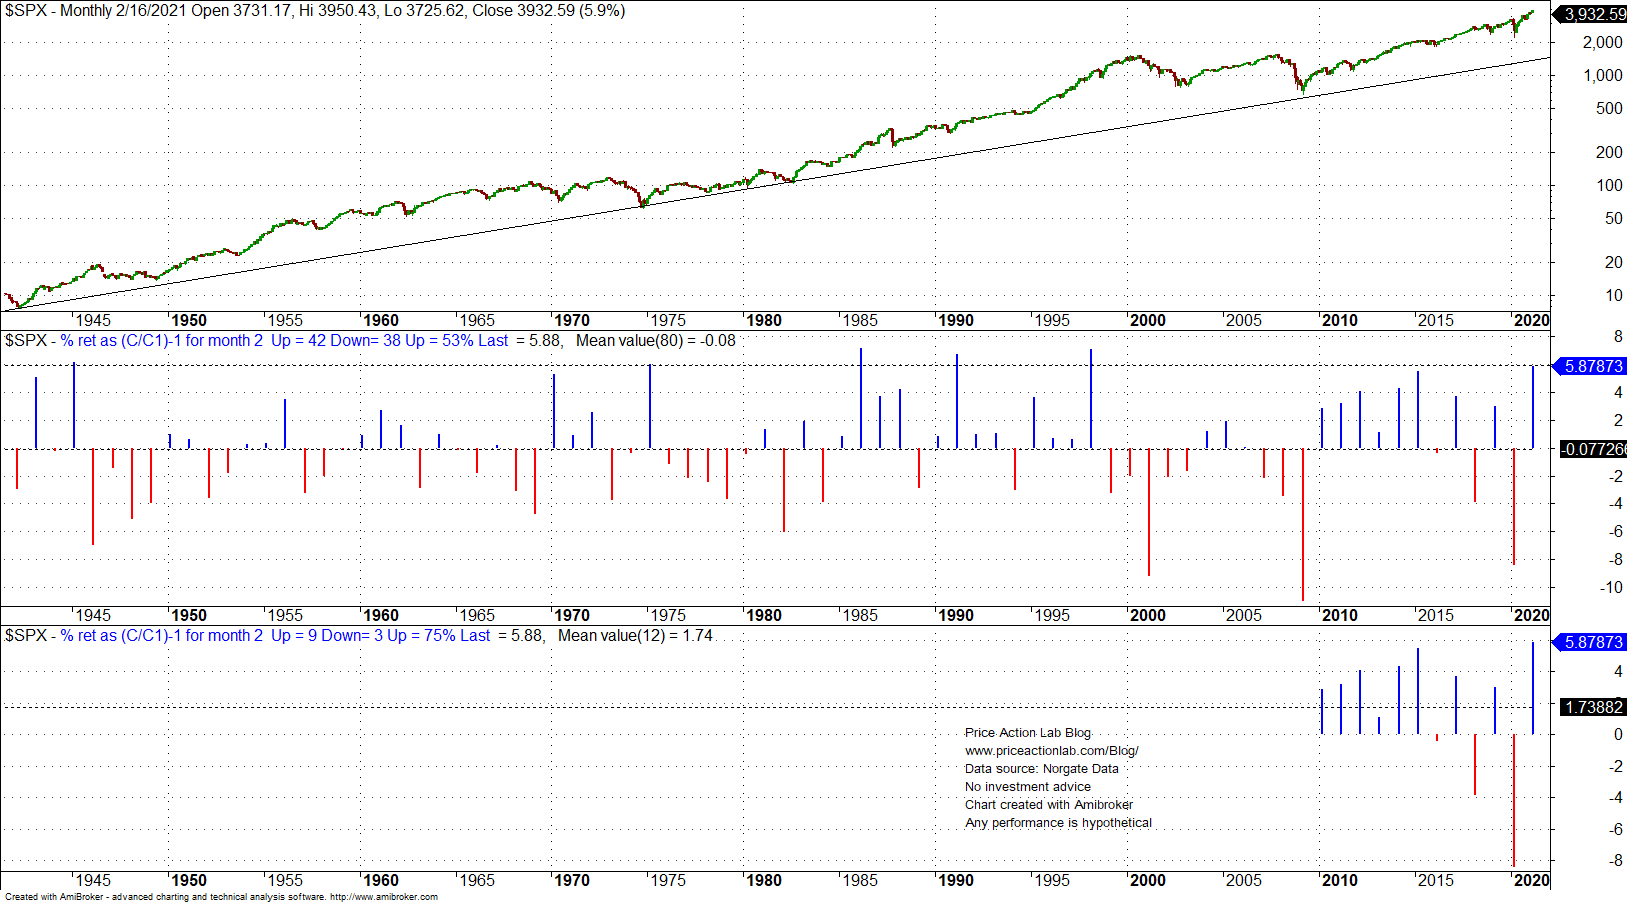
Despite the good average performance in the last 12 years of quantitative easing, the average return for February since 1941 is flat with 42 wins and 38 losses. Worse period was in the 2000s with an average return of about -1.9% from 2000 to 2010.
Note that these are fun statistics but useless in the context of forecasting. Trying to forecast monthly performance is similar to trying to forecast the next outcome of a coin toss. The only thing we know is that the stock market has a long upward bias in the monthly timeframe with 60.1% win rate and 0.71% average return since 1941, as shown below.
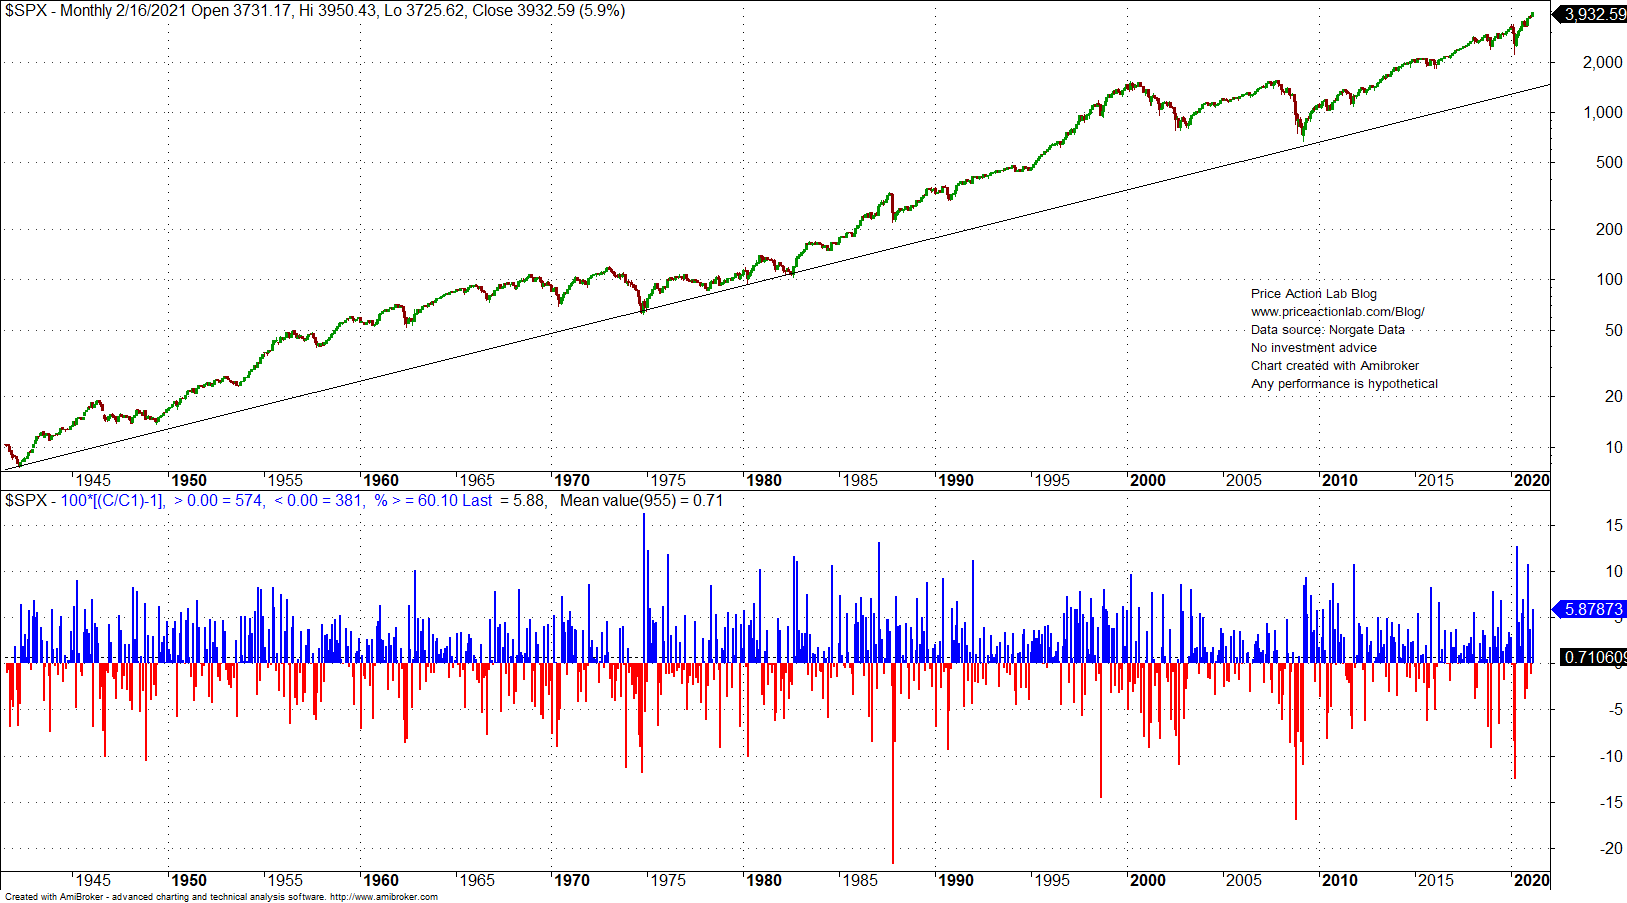
However, the distribution of monthly returns is not normal. Kurtosis is about 4.5 (excess) as shown below.

The distribution of monthly returns is far from normal but also close to nothing familiar. There is probably lack of sufficient sample and confidence for results of any forecasts cannot be estimated. Yet, there is a strong upward drift amid randomness, or for as long as there is one.
Charting and backtesting program: Amibroker
Data provider: Norgate Data
If you found this article interesting, you may follow this blog via push notifications, RSS or Email, or in Twitter

Click here to subscribe


