


When dealing with fundamental relationships, dual-axis charts do not provide a model and do not alleviate the need for a forecast. Yet dual-axis charts have been used extensively in financial social media in place of forecasts by assuming a relationship between two variables and the path of one of them.
Forecasts are hard, especially about markets and the economy. The availability of free online services such as FRED has created an army of analysts who often use confirmation bias to support a macro thesis with dual-axis charts. In many cases the charts are zoomed to support a thesis. Laypersons cannot see the disconnect and are impressed by the charts while not knowing those are created with a few clicks and what is hard is the interpretation , which in most cases is arbitrarily served to them.
Let us look at a specific example. A monthly dual-axis chart of real yields and price of gold was presented in financial social media recently, as follows.
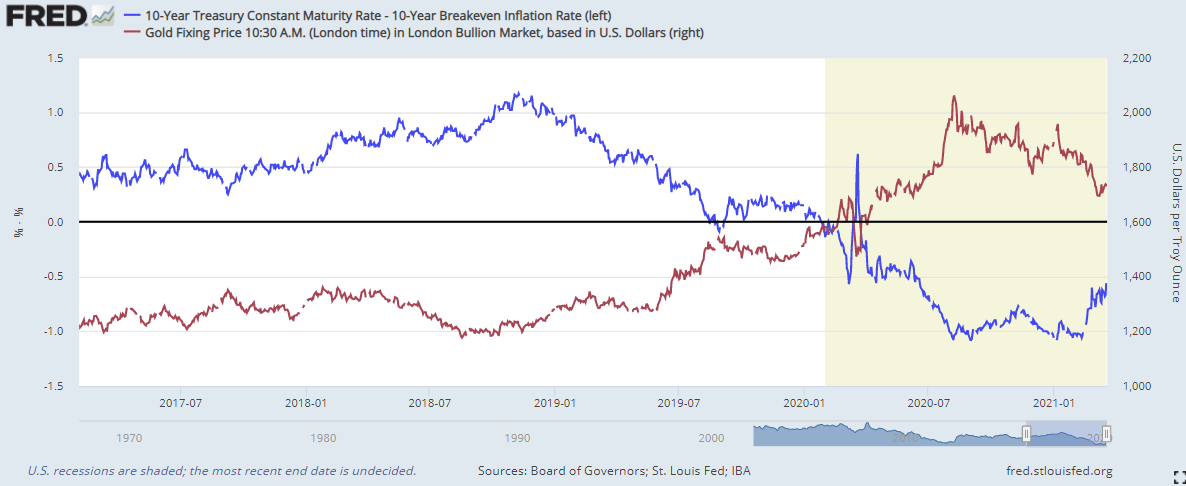
The chart was presented as this is a discovery a primitive artificial intelligence and data mining algo would have not found already. Crowds are impressed by dual-axis charts. They find a new guru who posted the chart and new hope for making money. But this chart is not a forecast. It cannot make money anyone who trades gold unless there is a forecast about real yields. If real yields continue on an uptrend, then it appears from the chart that gold should fall. But if real yields reverse course, it again appears from the chart that gold will rise.
But is there a possibility that real yields rise and gold also rises? Sure, but it was not shown on the chart because it was zoomed to support a certain thesis even though FRED provides more data.

It may be seen that during 2006 and 2010, for example, there were periods of rising real yields with rising gold prices. Regardless, suppose someone wants to buy/sell or short/cover gold. The above dual-axis chart does not provide a forecast but only that you need a forecast of real yields for that purpose. That is a whole different level of sophistication. But if you are able to forecast yields directly why not forecasting gold prices directly? In that case the dual-axis chart provides only entertainment value; it’s not actually needed.
A higher level issue is when two variables appear to be related on a dual-axis chart but this is due to conflating factors. Macro investors have learnt this lesson in hard ways. In markets, discovering causalities is nearly impossible; it’s like getting a license to print money but even loose associations are hard to discover due to conflating factors.
Dual-axis charts are good entertainment and the wishful thinking that often comes with them cannot replace the need for a forecast. “Forecasts are hard, especially about the future.”
Disclaimer: No part of the analysis in this blog constitutes a trade recommendation. The past performance of any trading system or methodology is not necessarily indicative of future results. Read the full disclaimer here.

Click here to subscribe
If you found this article interesting, you may follow this blog via push notifications, RSS or Email, or in Twitter


