


Statistics of price action derived from non-tradable indexes may not always be valid when ETFs are used. Here is an example based on the five day winning streak in S&P 500 as of March 15, 2021.
The S&P 500 was up five days in a row by the close of Monday, March 15, 2021. There were some statistics in the financial blogosphere related to a five-day winning streak in S&P 500. Are these statistics valid when considering instead the tradeable SPY ETF?
Below is a chart that shows instances of divergence returns between S&P 500 and SPY ETF since inception of the latter. By “divergent” we mean that the sign of the product of the daily returns of the index and the ETF is negative. The chart shows the sum of the daily returns when they diverge as SPY return minus S&P 500 return.

It may be seen from the first plot of divergence returns that the mean and standard deviation of this random variable changed significantly after about 2010. Since SPY ETF inception there are 336 divergent daily returns, or about 4.8% of the total. This is significant divergence that can affect the statistics when going from the index to the ETF for some short-term price patterns.
After 2010 as shown in the second plot the mean and standard deviation drop significantly, i.e., the divergences become less volatile and also less frequent. This is probably due to markets becoming more efficient.
It is not a coincidence then why some analysts show results after 2010 because before that they are not significant. Below is an example of a backtest of the five-day winning streak for entry at the close of the formation and exit at the close after five days.
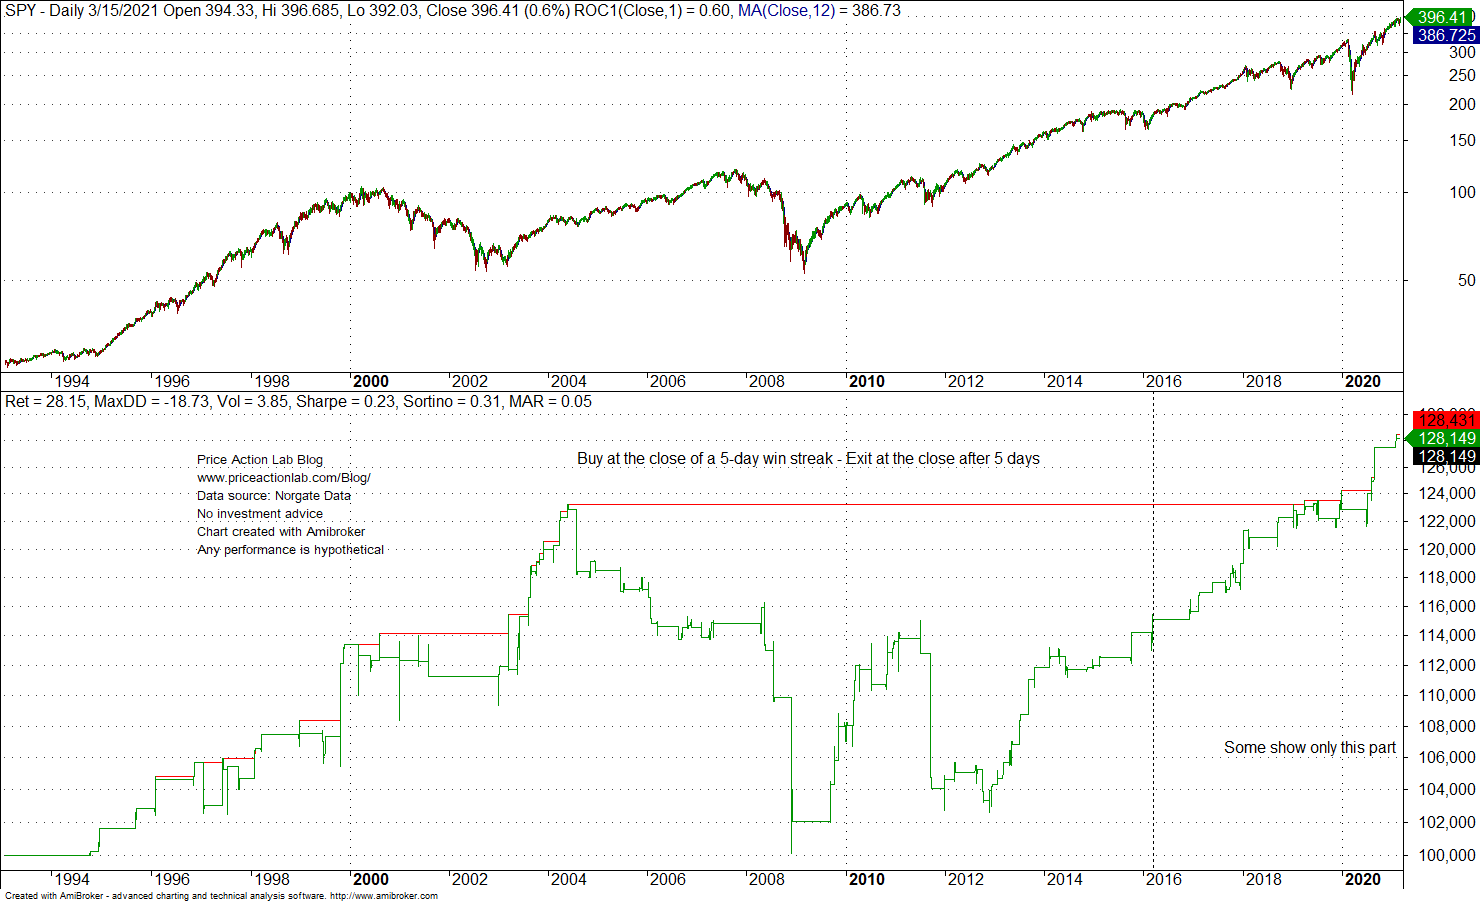
It may be seen that after 2010 the equity moves straight up. In fact, win rate is 75.4% for a sample of 61 non-overlapping trades. However, between 2004 and 2008 this price pattern trade causes significant losses of about 16%. Therefore, some decide not to show the bad performance in this case or in other cases of similar price action patterns.
I saw a claim recently that 5-day winning streaks in S&P 500 can generate high probability returns in the following five days. The return above is only 28.2% for this pattern. If we calibrate a biased coin to generate about the same number of trades in SPY since inception on the average and then simulate random entries with 5-day exists, then this is the resulting histogram.

The vertical black line shows the location of a return equal to 28.2%. The mean of the distribution is 39.3%. Crude ranking based on this empirical distribution indicates far from significant performance. In fact, the performance is a little worse-than-random on the average. This is to show that many price action patterns people think are significant are in reality random formations although the backtests say otherwise. The main reason some analysts are fooled in the case of SPY ETF and S&P 500 is the longer-term upward drift and the return divergences as discusses earlier in the article.

Charting and backtesting program: Amibroker
Data provider: Norgate Data
If you found this article interesting, you may follow this blog via push notifications, RSS or Email, or in Twitter


